tScan16™ - T1/E1 Analysis Hardware
(16 T1/E1 Rx Only Ports)
GL's tScan16™ is a high-density T1/E1 board with 16 ports and the newer PCIe (x1) bus interface. The sixteen T1/E1 ports are Receive-only ports optimized for high performance voice and data capture, monitoring, and analysis requirements.
Request a Demo / Quote Brochure
Overview
GL’s tScan16™ provides greater density, increased ports, and reduced power as compared to other TDM analysis tools on the market. The boards (with Direct Memory Access) are significantly faster, more efficient, and well-suited for High-Density Cabling.
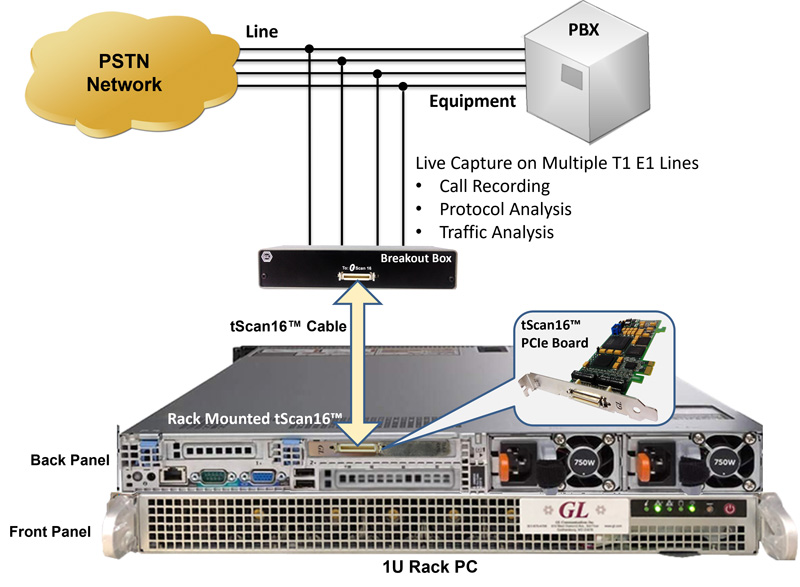
The tScan16™ consists of a PCI Express board housed in a host Windows® computer. Customers can use their own computer or GL can provide the PC as a rackmount (1U) or portable (Lunchbox) PC. Also included is the 16 port Breakout box for connecting to the TDM network under test. GL provides the necessary cable to connect the Breakout box to the PCI Express board. If customers elect to purchase the PC from GL, then GL will perform the full hardware and software installation giving the customer the ability to rapidly deploy the solution and perform analysis.
tScan16™ T1 E1 analyzers supports both 32-bit and 64-bit applications. 64-bit support improves the performance of the associated protocol analyzers such as ISDN, ISUP, GSM and allow users to monitor hundreds to thousands of signaling links simultaneously and continuously. Also, provides improved processing and response time for Statistics, Call Data Records, Search, and other such functions.
Key Features
- Software selectable 16 Rx Only T1 or E1 interfaces
- PCI Express x1 Lane/Board
- Convenient High Density Cabling
- Monitor T1/E1 line conditions such as frame errors, bipolar violations, alarms, frequency, power level, and clock (or frame/bit) slips.
- Comprehensive analysis of ISDN, SS7, Frame Relay, Multilink Frame Relay, PPP and Multilink PPP, HDLC, and many more protocols
- All protocol analyzers now include frame length in protocol statistics selection choice for data link layer
- Comprehensive analysis of Voice, Data, Fax, Protocols, and Digital signals, including Echo and Voice Quality testing
- Call Recording, Analysis, and Monitoring for hundreds to thousands of calls in one platform
- Most all “Rx Applications” are available with tScan16™
- Supports both 32-bit and 64-bit Windows® operating system
- The data (Signaling, and Traffic Call Data Records) collected at probe-level are stored into a relational database (Oracle) using Open Database Connectivity. With the use of NetSurveyorWeb™ application, the real-time and historic call data records can be accessed using simple web browser interface for remote or local monitoring
Use of tScan16™ Breakout Box in Monitor Mode
tScan™ with DSX1 Patch Panel
tScan™ without DSX1 Patch Panel
For more details on the usage of Breakout Box, please download tScan16™ Breakout Box Reference Guide
Specifications
| Physical Interface |
|
|---|---|
T1/E1 |
(16) Dual RJ45c Jacks on the Breakout Board |
Connector |
MDR 36-Pin Connector (3M Mini D Ribbon cable) to interface Breakout Board with Main Board |
PC Interface |
PCI Express x1 Lane |
| Environmental Specifications |
|
|---|---|
Temperature |
Operating: 0 to 50° C |
Relative Humidity |
Operating: 10% to 90% (non-condensing) |
Altitude |
Operating: -100 to 12,000 ft. |
| T1/E1 Line Interface |
|
|---|---|
Framing Formats |
Unframed, D4 (T1) , ESF(T1), ESF(J1), CAS(E1), FAS(E1), CRC4 |
Line Code format |
AMI, B8ZS (T1) or HDB3 (E1) |
| Altitude | Operating: -100 to 12,000 ft. Storage: -100 to 40,000 ft. |
Internal Clock Specification |
Standard: +/- 3ppm Optional: +/- 1ppm |
| PCM Interface |
|
|---|---|
Receive |
|
| Specification Compliance |
|
|---|---|
T1/E1 Interface Hardware Compliance |
|
Facility Data Link |
T1 ESF Mode: Transmit/Receive Messages, Bit-Oriented Messages, and Files. |
Zero Suppression |
B7 Stuffing, Transparent, & B8ZS (T1) |
Signaling |
Robbed-Bit or Clear Channel |
Frequency Offset |
E1: +/- 615Hz |
| Receive |
|
|---|---|
Input Impedance |
100 ohms for Terminate and Monitor (T1) |
Terminations |
Terminate and Monitor |
T1 Input Frequency |
1.544MHz +/- 20KHz |
E1 Input Frequency |
2.048Mhz +/- 20KHz |
Frequency Measurement |
+/- 1ppm |
Error Detection |
Frame Error, CRC Error, CAS Multiframe Error, BPV Error, Frame Alignment Error |
Alarm Detection |
T1 - D4 Yellow Alarm, ESF Yellow Alarm |
Input Range |
T1: |
| Display and Logging |
|
|---|---|
BERT |
Bit Errors, Bit Error Rate, Error Seconds, Error Free Seconds, %EFS, Severely Error Seconds, % SES, Degraded Minutes, %Dmin, Loss Pattern Sync Count, Loss of Sync Seconds, Available Seconds, %Available Seconds, Unavailable Seconds, Bipolar Violations, BPV Rate, BPV Seconds, BPV Free Seconds, Frame Errors, FE Rate, FE Seconds, FE Free Seconds, with Detailed logging into disk file. |
Alarms |
Resync In Progress, Loss of Signal, Blue Alarm, Change of Frame Alignment, Bipolar Violation, Frame Error, Carrier Loss, Yellow Alarm, Out of Frame Events Counter, Error Super frame Counter, Bipolar Violations, Remote Alarm, Distant Multiframe Alarm, Signaling All Ones, CAS Multiframe Error, CRC4 Error. |
| Computer Requirement |
|
|---|---|
|
Core i3 or higher on Windows® 11 with PCIe expansion slots (3.3V or 5.0V) |
| Physical Dimensions |
|
|---|---|
Dimensions |
6.60’’ long, 2.71’’ high (2U high) –from the top to the bottom of the PCIe tab, the lowest point on the board tScan16 Full Height bracket (for normal standalone PCs): 4.725’’ high tScan16 Half Height bracket (for 2U rack PCs): 3.118’’ high tScan16 Breakout Box: 7.29’’ wide, 1.52’’ high, 2.5’’ deep |
Supported Rx Applications
tScan16™ supports almost all Rx Applications (monitoring applications) available with GL’s regular T1/E1 analyzers.
Basic Applications
- Byte Values & Binary Byte Values
- Signaling bits, Power Level, DC Offset, & Frequency
- Multi-frames, and Real-time Multi-frames
- T1/E1 Data as Real-time Bitmap
- Timeslot Window
- ASCII Timeslot Display
- Oscilloscope & Power Spectral
- Audio Monitoring & Active Voice Level
- BERT
- Windows Client / Server
- Manual, Automated Record Files
Optional Applications
- Protocol Analysis: ISDN, HDLC, SS7, GSM, GPRS, UMTS, Frame Relay, ATM, PPP, TRAU, T1 Facility Data Link , E1 Maintenance Data Link (Sa HDLC, and SSM), and more
- WCS Modules: Rx files, digits, Multi-channel BERT, DSP operations, Dynamic DSP capability
- Capture & Analysis : DTMF / MF / MFCR2, Digits, Tones, Voice, Modem, Raw Data
- Call Data Records
- Voice Band Analysis Software
- Multi-Channel BERT
- Protocol Identifier
- Signaling Transitions Recording
- Real-time Strip Chart
- Real-time Multichannel Audio Bridge
- Multiplex / Demultiplex Software
- Network Surveillance, Voice Quality Testing
- Echo and Delay Measurements
Monitoring Applications
tScan16™ supports almost all Rx Applications (monitoring applications) available with GL's regular T1/E1 analyzers.
Byte Values & Binary Byte Values
This application displays the data values for each time slot in HEX data format. These values will be changing very rapidly, as each timeslot's data rate is 8000 bytes/sec.
Monitor Signaling bits
The signaling bits associated with each timeslot are displayed in real-time. For T1 cards, the received signaling bits A and B for 193S (D4 Framing Format) and A, B, C, and D for 193E (ESF Framing Format) are displayed for all channels.
For E1 Cards, this application should be used in CAS mode only. The signaling bits A, B, C, and D are displayed for all channels. These bits are demultiplexed from timeslot 16.
Power Level Display for all time slots
The rms (root-mean-square) value of the digital codewords (after expansion from µ-Law or A-law) for each timeslot is computed and continuously displayed in dBm. The number of samples used in the computation is 192.
DC Offset Display for all time slots
The DC Offset application provides the capability to measure and display DC offsets for all timeslots. Multiple instances of this application may be opened simultaneously to monitor DC offsets on more than one GL card.
Frequency Display for all time slots
A continuous display of the signal frequency in each timeslot is displayed. The frequency is computed using the zero-crossing rate of the samples from each channel. The number of samples used in the calculation is 4000.
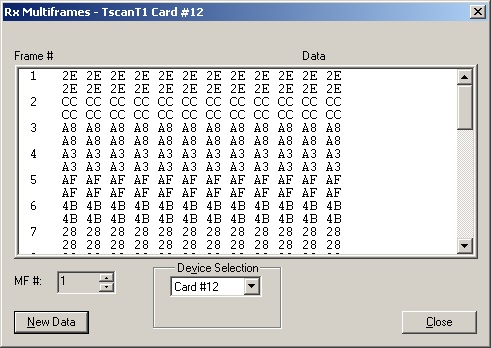
Multiframe Byte Display
This application permits viewing of complete multiframes. Approximately one second of data is captured, or 682 multiframes in T1 ESF/193E, 1364 multiframes in T1 D4/193S, 1024 multiframes for E1. The data is displayed with each frame identified. For T1 systems, twelve (12) frames are displayed per multiframe in D4 (193S) framing format, and twenty-four (24) frames in ESF (193E) framing format. For E1 systems, 16 frames are displayed per multiframe.
Real Time Multiframe Monitoring
This application permits viewing of multiframes in real-time. The data is refreshed for about every second. For T1 systems, twelve frames are displayed per multiframe in D4 (193S) framing format. Twenty-four (24) frames are displayed in ESF (193E) framing format. For E1 systems, 16 frames are displayed per multiframe.
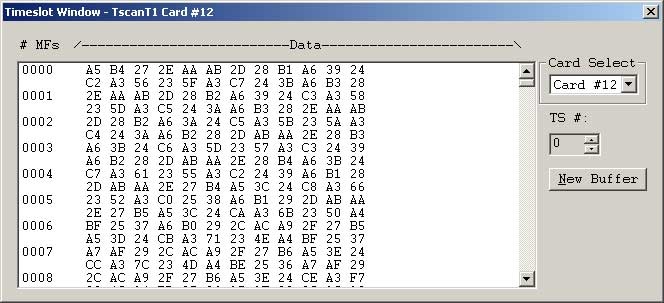
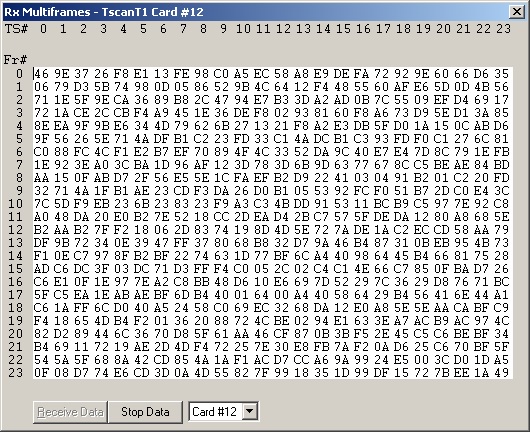
Timeslot Window
This window displays the timeslot value for about '2' second duration for a desired timeslot. Ability to change the particular timeslot is also provided. "New Buffer" button allows refreshing of the data. The "Timeslot Window" module differs from "Multiframes" module, in which all the multiframes for a particular timeslot are displayed.
- Data of about two-second duration is displayed. In "Multiframes",
- T1 D4/193S: 1364 multiframes are displayed
- T1 ESF/193E: 682 multiframes are displayed
- E1: 1024 multiframes are displayed
ASCII Timeslot Display
This application permits viewing of real-time ASCII events that are present on the T1 or E1. The ability to display the ASCII events for a particular port and timeslot is provided. Each event is properly time-stamped for tests that require time correlation. Logging real-time events to the hard drive is also possible; this is useful during overnight or long-term testing.
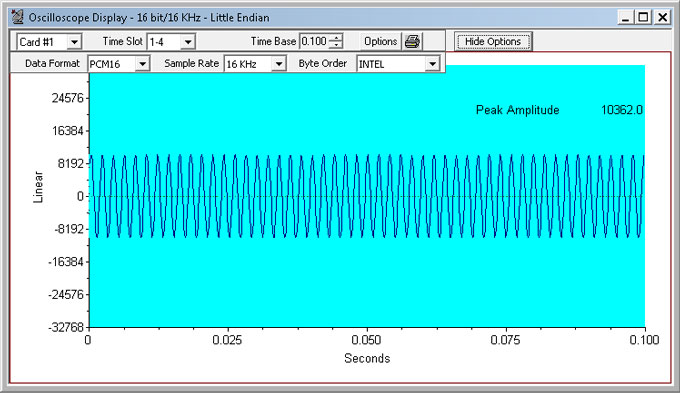
Oscilloscope & Power Spectral
The PCM codes (amplitude of the incoming signal) of any selected timeslot are displayed in real-time graph as a function of time. Timeslot selection and time base can be changed to either view different incoming timeslots or modify the duration of the display. The time base can be adjusted from approximately 0.005 sec full scale to 1.000 sec full scale. This application can be used to visually assess activities on the channel such as noise, tone, speech, etc. The data may be displayed for all signaling formats – alaw, mulaw, pcm16, pcm13, pcm14, pcm8, and different byte order for INTEL (Little Endian), and MOTOROLA (Big Endian).
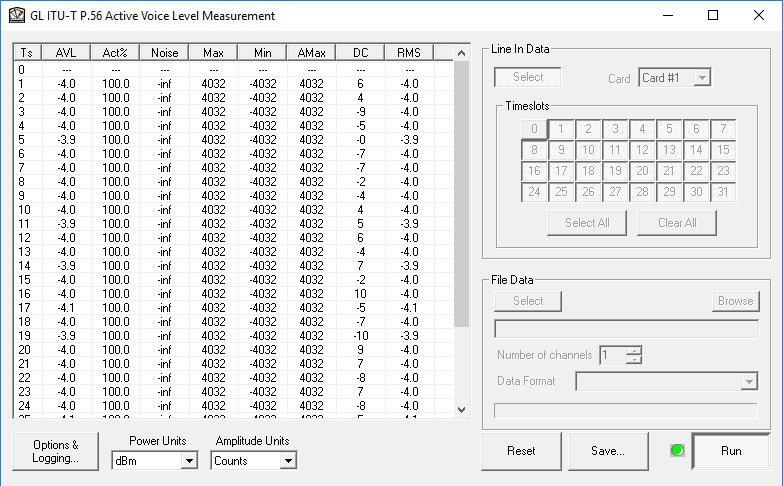
Active Voice Level
The Active Voice Level Monitor computes the Active Voice Level of a signal according to the ITU-T P.56 specification, Method B. This analyzes the source signal in real-time from T1/E1 timeslots, or process the captured signal data files offline. This application is available under the Monitor Menu in T1/E1 analyzer software.
Protocol Analyzers
Physical Layer Analyzer
The Physical Layer Analyzer application monitors the T1 E1 or T3 E3 Alarms in real-time, converts them to SNMP messages and sends them to the Network Operations Center (NOC). ON/OFF status in the Physical Layer Analyzer depicts the Alarm/No Alarm state respectively. SNMP DS1/DS3 Traps sent from T1/E1 or T3/E3 Physical Layer Analyzer can be monitored on the configured IP Address and UDP Port using any SNMP or MIB browser. When the alarm status changes, then SNMP Traps will be sent to the NOC.
Protocol Identifier
The Protocol Identifier application can identify various protocols carried on T1 or E1 lines. It is capable of detecting protocols such as ISDN, ATM, HDLC, MTP2, LAPD, SS7, PPP, GSM, GSM Abis, TRAU, and Frame Relay. The timeslots and the subchannels within timeslots are also identified. Once identified, detailed analysis can be carried out by individual Protocol Analyzers. This application is helpful in identifying traffic types at a concentration point, DSX patch panel, or multiplexed facility.
Protocol Analysis
GL's Protocol Analyzers can be used to diagnose signaling problems quickly and effectively by analyzing traffic on multi-protocol signaling networks. It monitors signaling interactions in fixed, access and wireless networks. It analyzes multiple protocols like Physical Layer Alarms & Errors, HDLC, Frame relay, SS7, ISDN, TRAU, ATM, GSM, GPRS, GR-303, CDMA 2000, E1 Maintenance Data Link, V5.x, ML-PPP, UMTS, Facility Data Link for T1, and SS1. It can make measurements on up to 32 duplex time slots from up to 4 duplex E1 or T1 trunks. It also allows measurements on Ethernet based traffic. GL's protocol analyzer can be easily configured to capture fractional E1 or T1 (DS0), sub-channels, hyper-channels and more.
Windows Client/Server based Applications
WCS based various Analysis Modules (XX600 Included with Basic Analyzer)
Client / Server applications allow the user (with an appropriate client) to operate analyzers remotely, write scripts for automation, or provide multi client connectivity to a single T1 E1 Data analyzer. Almost every GUI application has a WCS counterpart. Now, Windows Client / Server available as a part of Basic Applications in T1/E1 Analyzer. GL provides sample-working clients in C++, VB, and TCL along with the server. With additional licenses, WCS supports reception of files/digits, Multi-channel BERT, DSP operations, Dynamic DSP capability.
Various protocol decode agent modules are supported by WCS application.
Call Capture and Analysis
Call Capture and Analysis-(Full Duplex Capture w/ Dual Unit)
The T1/E1 Call Capture and Analysis Software (XX031) provide the capability to non-intrusively record calls directly from T1/E1 lines. The call capture can be done manually or auto-triggered based on ISDN/SS7 messages, signaling, traffic such as - voice, digits, tones, fax, modem, and any signal based on power-level.
Call Data Record (CDR)
The T1/E1 Call Data Record Software (CDR032) compiles the output of CCA (Call Capture and Analysis) application and (optionally) VBA (Voice Band Analyzer) application and generates Call Summary and Call Detail types of reports. CDR provides comprehensive information on each and every call occurring on T1 and E1 lines, including - voice capture, signaling information, alarms and errors occurring during the call, voiceband event information, and categorization of the call as voice, fax, modem, or data.
Near Real-time Voice-band Analyzer
The Near Real-time Voice-band Analyzer (VBA) is an analysis tool for monitoring voice band network traffic over VoIP, TDM and wireless networks. Built-in algorithms include ITU-T P.56 Active Voice Level analysis, Line Echo (Hybrid) analysis, and Traffic Classifier. It supports A-Law, µ-Law, 16-bit PCM (Intel), 16-bit PCM (Motorola) and MS Wave file formats. FaxScan™ module within VBA can be used to decode both 2-wire and 4-wire voice band captures to produce the Fax TIF image and other transmission information.
Multiple Call Capture and Analysis
GL’s Multi CCA application is similar to CCA, where in it is used to monitor hundreds of calls, capture the bidirectional data, signaling and traffic, simultaneously from multiple T1/E1 lines, based on the user-defined trigger configurations. Once the capture trigger type is selected, users can control and run multiple capture instances on different T1/E1 ports from a single GUI.
- CCA along with CDR and VBA allows monitoring IVR systems for voice and data quality
- Automate the IVR testing process - call establishment and traffic generation / detection process through scripts
- Monitoring IVR System for voice and data quality
Record/Playback Applications
Record Disk Files
This optional software permits the user to transmit and or capture any signal on T1 or E1 lines with GL's tScan16™ Cards. Typical applications include transmission or capture of prerecorded video files and protocol analysis.
Fo more information, visit T1E1 Data Transmit Receive.
Record from multiple cards
This application permits capture of data being transmitted on (any one or both) T1/E1 cards to a file.
Automated Continuous Capture
Automated Continuous Capture (ACC) allows users to capture different types of data (*.ala, *.ula, *.pcm, *.wav, *.ber) continuously into different files. Instead of capturing data from a card in one big block, it is possible to capture seamless chunks of data in files of the specified size, or specified time limit of capture.
Multi-channel Bit Error Rate Testing (MCBERT)
Measures correctness of data received on T1/E1 lines/timeslots with stored data in a reference file. The application can work in real-time with data currently being received on T1/E1 lines/timeslots, or off-line with data stored in a file. The on-line T1/E1 testing can be done on full or fractional T1/E1 timeslots.
For more information visit, Multi-channel Bit Error Rate Testing
The Real-Time Multi-Channel Audio Bridge
The Real-Time Multi-Channel Audio Bridge has the ability to send and receive audio between a sound card and T1 E1 timeslots. Real-Time Multi-Channel Audio Bridge application provides a bridge between T1 E1 timeslots and single or multichannel sound card(s).
The application allows user to insert speech onto T1 E1 timeslots using the PC microphone.
Also, listen to speech on T1 E1 timeslots using PC speakers or Headphones. This application is available as a part of basic applications with all T1 E1 analyzers.
GLC View waveform viewer
GLC View is a waveform viewing application. It has been designed specifically as a companion application for the GL Communications Inc. T1/E1 Echo Canceller Test Suite.
Network Surveillance System
T1/E1/T3/E3 Probes are deployed in the field to monitor various protocols (including ISDN, SS7, GSM, CDMA, and others) and conditions. These probes can process protocol information at varying levels (intelligent software) to extract information of choice, export these information to a central database, and communicate with the NMS through TCP / IP. Data records are stored into a centralized database (Oracle) using ODBC. With the use of web server, the remote / local monitoring can be accessed using simple web browser interface such as NetSurveyorWeb™.
The NetSurveyorWeb™ for T1E1 Physical Layer provides an instant overall graphical view of the health of the TDM network with drill down to individual lines; secure access through WEB; remote monitoring and diagnostics to troubleshoot any T1 E1 line; and a central database and applications for controlling, collecting, and analyzing the information provided by the various probes.
For more information visit, Digital T1 E1 Line Monitoring Netsurveyorweb™
Resources
Please Note: The XX in the Item No. refers to the hardware platform, listed at the bottom of the Buyer's Guide, which the software will be running on. Therefore, XX can either be ETA or EEA (Octal/Quad Boards), PTA or PEA (tProbe Units), XUT or XUE (Dual PCIe Express) depending upon the hardware.
| Item | Description |
| TTE001 | tScan16™ Express Card |
| TUT001 | T1 16 Port License for Basic Software |
| TUE001 | E1 16 Port License for Basic Software |
| Optional Software | |
| XX018 | Multi-Channel BERT Software |
| XX020 | Record and Playback of Files |
| XX021 | FDL Software for ESF (T1 only) |
| XX022 | DTMF/MF Detector &Generator Software |
| Call Capture and Analysis Software Options | |
| XX031 | Enhanced T1 / E1 Call Capture/Analysis Software |
| XX031 | T1 or E1 Call Capture and Analysis Software w/ Traffic Activated Trigger Option |
| CDR032 | Call Data Records |
| Voice Band Analysis Software Options | |
| VBA032 | Voice Band Analyzer |
| VBA033 | Two-Wire Echo Analysis for VBA |
| VBA036 | Traffic Analysis for VBA |
| Windows Client-Server Software Options | |
| XX600 | Basic Client/Server Scripted Control Software (Included with Basic Software) |
| XX605 | Dual VF Tx Rx (Only for tProbe) (Included with Basic Software) |
| XX606 | Pulse Shape & Jitter Measurement (Included with Basic Software) |
| Protocol Analyzers and Emulators | |
| XX089 | Protocol Identifier |
| XX090 OLV090 |
T1 or E1 Real-Time HDLC Analysis/Playback/Simulate Software Offline/ Remote HDLC Analyzer |
| XX095 OLV095 |
E1 Real-Time SA Bit HDLC Analysis Offline SA Bit HDLC Analyzer |
| XX100 OLV100 |
T1 or E1 Real-Time ISDN Protocol Analyzer Offline / Remote ISDN Analyzer |
| XX105 | T1 or E1 Real-Time ISDN Protocol Emulator |
| XX110 OLV110 |
E1 Real-Time V5.x Protocol Analyzer Offline / Remote V5.x Analyzer |
| XX120 OLV120 |
T1 or E1 Real-Time SS7 Protocol Analyzer Offline / Remote SS7 Analyzer |
| XX130 OLV130 |
T1 or E1 Real-Time Frame Relay Protocol Analyzer Offline/ Remote Frame Relay Analyzer |
| XX135 OLV135 |
ML-PPP Analyzer Offline ML-PPP Analyzer |
| XX136 OLV136 |
PPP and MLPPP Packet Analysis Offline PPP and ML-PPP Packet Analysis |
| XX140 OLV140 |
T1 or E1 Real-Time GR303 Protocol Analyzer Offline/ Remote GR303 Analyzer |
| XX142 OLV142 |
CDMA2000 Protocol Analyzer Offline CDMA2000 Analyzer |
| XX150 OLV150 |
T1 E1 Real-Time GSM Protocol Analyzer Offline GSM Analyzer |
| XX151 OLV151 |
w/Motorola Mobis Decode with Motorola Mobis decodes |
| XX153 OLV153 |
T1 E1 Real-Time TRAU Protocol Analyzer TRAU Traffic Playback TRAU Toolbox™ Offline TRAU Analyzer |
| XX155 OLV155 |
T1 or E1 Real-Time GPRS Protocol Analyzer Offline GPRS Analyzer |
| XX160 OLV160 |
T1 or E1 Real-Time ATM Analyzer Offline ATM Analyzer |
| XX162 | ATM BERT |
| Network Monitoring Software Options | |
| PKV170 | NetsurveyorWeb™ (Perpetual License, Unlimited Users/Nodes) – Includes Oracle 11g Standard Edition One and Standard Server-Grade Computing Platform |
| PKV169 | NetsurveyorWeb™ Lite Probe Level WebServer, PacketScan™, and Oracle 11g Express Edition; |
| PKV171 | NetSurveyor Agent Toolkit |
| DCME Related Software Options DC007 | |
| DC007 | DCME Test & Analysis Software w/Desktop PC |
| DC008 | DC008 DCME Test & Analysis Software w/Portable PC |
| Brochures |
| T1E1 tScan16™ Analyzer Brochure |
| Presentations |
| T1E1 tScan16™ Analyzer Presentation |