ATM Protocol Analyzer
Overview
Asynchronous Transfer Mode (ATM) is a flexible network, which carries voice, video, and data in the same way, i.e. fixed length cells. It has generated a number of revenue opportunities because of its different classes of service support for multimedia traffic, efficient bandwidth management for burst traffic, support for LAN/WAN architecture and high performance via hardware switching.
ATM network basically has two kinds of interfaces i.e. UNI (Interface between ATM User and Public ATM switch) and NNI (Interface between two Public ATM switches). Similar to the OSI Protocol model, ATM has an ATM Layer as Layer 2, ATM Adaptation Layer (AAL) as Layer 3 and other higher layers depending on C-Plane, U-Plane or Layer Management Plane. User information is transferred across U-Plane and signaling messages is transferred across C-Plane. ATM-UNI signaling is used to create and release SVCs along with a particular QoS attached to it depending bandwidth on demand.
GL's ATM Analyzer is used to analyze and decode different ATM protocols like ATM, AAL2 Protocols (CPS-SDU, SSSAR-SDU, and SSCS), AAL5 (CPCS), UNI etc across U plane and C plane of UNI and NNI interface. The analyzer can also decode ATM frames constituting Classical IP over ATM, or CIP based networks, and traditional SS7 Stack (ISUP, SCCP, MAP, CAMEL (CAP) etc) over ATM. The analyzer is also capable of capturing & reassembling frames that were transmitted with Inverse Multiplexing. IMA combines up to 8 T1 E1 links to form a single high-speed connection with flexible bandwidth options.
GL Communications supports the following types of ATM analyzers:
- Real-time ATM Analyzer (Pre-requisites: GL's field proven E1 or T1 internal cards or USB Laptop E1 or T1 external units, required licenses and Windows Operating System)
- Offline ATM Analyzers (Pre-requisites: Hardware Dongle and Windows Operating System)
ATM Analyzer Main Features
- Displays Summary, Detail, Hex-dump, Statistics, and Call Trace Views, the contents of this view can also be copied to clipboard
- Summary View displays Dev #, Time Slot, Frame #, VPI/VCI, PT (Payload Type), HEC, OSF, AAL Type, Frame Type, CID, LI, CPI, UUI, SSSAR CID and SSCS message type and more in a tabular format
- Detail view displays decodes of user-selected frames from the Summary View, the contents of this view can also be copied to clipboard
- Hex dump view displays raw frame data as hexadecimal and ASCII octet dump , the contents of this view can also be copied to clipboard
- Statistics view displays statistics based on frame count, byte count, frames/sec, bytes/sec etc for the entire capture data
- Call trace capability based on UNI signaling parameters, VPI/VCI etc
- CRC verification for AAL5 carrying packet data
- Support of various UNI Signaling Protocols i.e. UNI 4.0, UNI 3.1 and UNI Q-2931
- Supports decoding of Classical IP over ATM, Multi-Protocol over ATM, and SS7 signaling over ATM
- Supports search and filtering capabilities
- Any protocol field can be added to the summary view, filtering, and search features providing users more flexibility to monitor required protocol fields
- Ability to configure .ini file to get the proper decoding (customize options such as VPI:VCI values, or detect presence of HEC in ATM header)
- Capability to export Summary View details to comma separated values (CSV) format for subsequent import into a database or spreadsheet
- Capability to export detail decode information to an ASCII
- Option to create multiple aggregate column groups and prioritize the groups as per the requirement to display the summary results efficiently
- Allows the user to create search/filter criteria automatically from the current screen selection
- Remote monitoring capability using GL's Network Surveillance System
Additional features supported by Real-time ATM Analyzer are:
- Captures, decodes, filters, and reassembles AAL-2 and AAL-5 frames in real-time, from within the ATM cells according to user defined VPI/VCI.
- Recorded raw data can be played back using raw data playback application.
- The following variations are accommodated in the software: inverted or non-inverted data, byte reversal or non-reversal, with or without Inverse Multiplexing option.
- Unscrambling of ATM cells based on SDH X^43 + 1 algorithm.
- Multiple streams of ATM traffic on various T1 E1 channels can be simultaneously decoded with different GUI instances.
- Streams may be captured on the selected time slots (contiguous or non-contiguous) and on full bandwidth.
Additional features supported by Offline ATM Analyzer:
- Trace files for analysis can be loaded through simple command-line arguments
- Multiple trace files can be loaded simultaneously with different GUI instances for offline analysis
Protocols Supported
The list of protocols that are supported by GL's ATM analyzer are as given below:
The supported protocol standards in ATM analyzer are AAL2,5 (UNI 3.1), AAL2,5 (UNI 4.0), AAL2,5 (UNI Q.2931), SS7 ITU, SS7 ANSI, and SS7 ETSI
ATM Protocol Stack
Classical IP Over ATM Protocol Stack
SS7 Over ATM Protocol Stack
| Supported Protocols | Specification Used |
|---|---|
| ATM | ITU-T I.361 |
| AAL | ITU-T I.363 |
| SSSAR | ITU-T I.366.1 |
| SSCS | ITU-T I.366.2 |
| AAL2 | Class B (ITU-T I.363.2) |
| AAL5 | Class C & D (ITU-T I.363.5) |
| SSCOP | ITU-T Q.2110 |
| UNI | Q.2931 & Q.2971 |
| UNI3.1 | ATM User-Network Interface Specification Version 3.1 |
| UNI4.0 | ATM User-Network Interface Specification Version 4.0 |
| OAM | IM for ATM Version 1.1 AF-PHY-0086.001 March, 1999 |
| MAC | IEEE 802.3 |
| IP | RFC 791 |
| IPv6 | RFC 2460, RFC 2402, RFC 2406 |
| TCP | RFC 793 |
| UDP | RFC 768 |
| ICMP | RFC 792 |
| ICMPv6 | RFC 2463, 2461, 1885, 2894, 3122, 3810, 3775, 3971, 4286, 4066 |
| Payload (Multiprotocol Encapsulation over AAL) | RFC2684 |
| Classical IP and ARP over ATM | RFC 2225 |
| MTP3b | ITU-T Q.2210 |
| SSCF UNI | ITU-T Q.2130 |
| SSCF NNI | ITU-T Q.2140 |
For more information, visit protocol glossary webpage
Summary, Detail, and Hex-dump Views
Summary, Detail, Hex-dump and Statistics Views
The ATM analyzer application is invoked from the main menu of GL's T1 E1 Analyzer for real-time analyzer. The offline ATM analyzer is invoked from the installation directory of the offline ATM Analyzer. The analyzer displays Summary, Detail, Call Trace, Statistics, and Hex dump views in different panes. The Summary pane displays Dev#, Time Slot, Frame#, Time, Length, Error, VPI/VCI, PT and so on. User can select a frame in summary view to analyze and decode each frame in the Detail View. The Hex dump View displays the frame information in HEX and ASCII format. The contents of Detail and Hex Dump view the contents of this view can also be copied to clipboard
Real-time and Offline Analysis
Screen Shot of Timeslot selection
Users can capture and analyze UNI and NNI interfaces in real-time and record all or filtered traffic into a trace file. The recorded trace file can be used for offline analysis or exported to a comma-delimited file, or ASCII file.
ATM raw data capturing requires user to specify timeslots, bit inversion, octet bit reversion, user/network side, ATM mapping, scrambling, and inverse multiplexing options. Captured raw data can then be transmitted using playback file application.
Inverse Multiplexing Over ATM (IMA)
The ATM Analyzer is enhanced to capture & reassemble frames that were transmitted with Inverse Multiplexing option. With Inverse Multiplexing over ATM (IMA) feature, up to 8 T1 E1 links can be configured to form a high-speed connection. ATM cells are transmitted across multiple interfaces in a cyclical fashion, and recombined to form the original stream. By default ATM supports IMA Frame Length equal to 128. User can configure IMA Frame Length ranging from 32, 64, or 256.
Screen Shot of IMA Working Principle
Screen Shot of Captured ATM frames with IMA
Filtering and Search
The user can record all or filtered traffic into a trace file and can create search/filter criteria automatically from the current screen selection. The filter and search options add a powerful dimension to the ATM analyzer that isolates required frames from the captured frames in real-time/remote/offline.
Users can specify custom VPI, VCI, and PT type values to filter frames during real-time capture. The frames can also be filtered after completion of capture according to Dev#, Time Slot, Frame #, Time, Length, Error, VPI/VCI, PT (Payload Type), HEC, OSF, AAL Type, Frame Type, CID, LI, CPI, UUI, and more. Similarly, search capability helps user to search for a particular frame based on specific search criteria.
Screen Shot of Setting the Filtering Criteria
Screen Shot of Setting Real-time Capture Filter
Aggregate Column Group
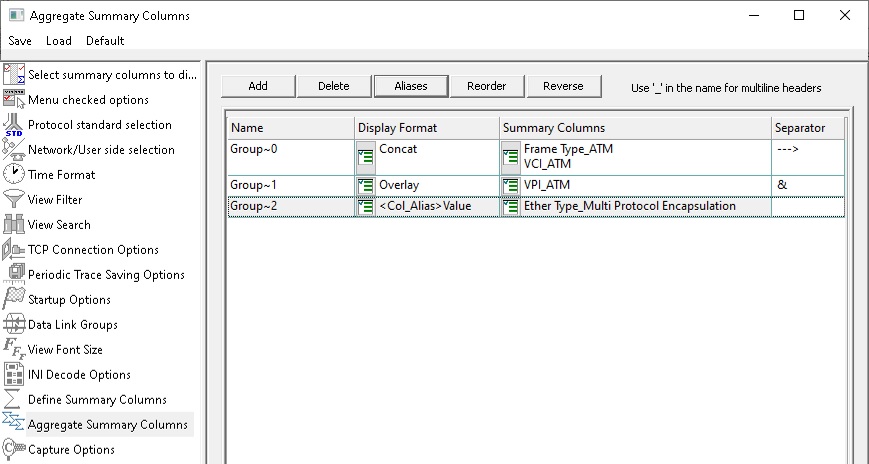
Aggregate Summary Column Group
The enhanced feature of the protocol analyzer is aggregate column groups. The user can also create multiple aggregate column groups and prioritize the groups as per the requirement to display the summary results in an efficient way.
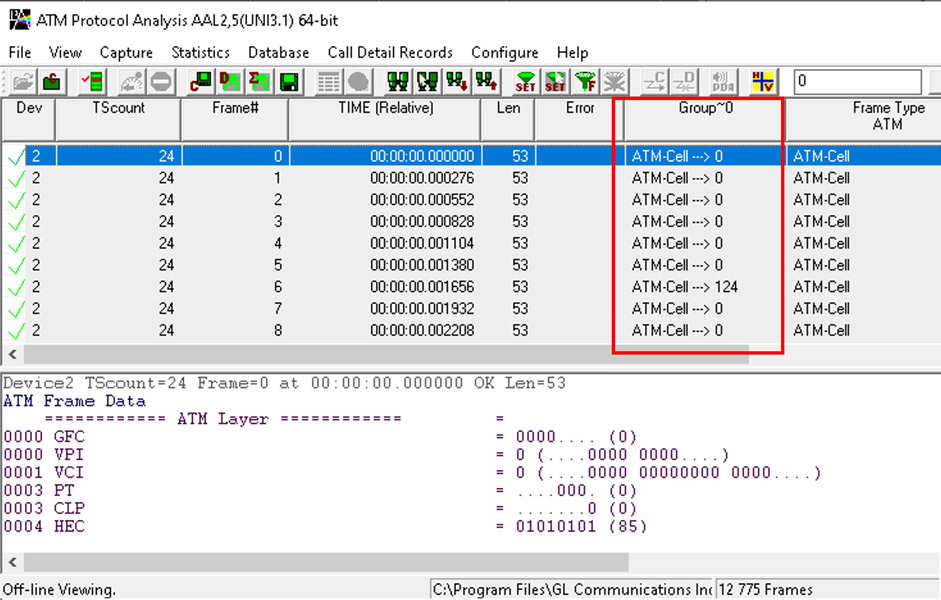
Display of Aggregate Column Group in Summary View
The updated results are as shown below. Here the root aggregate group~0 summary columns are displayed first and then Group~1 and Group~2 as per the assigned priority.
Reassembly
Screen Shot of Reassembly Parameters
Using reassembly option user can specify VPI /VCI value to reassemble as per the Segmentation and Reassembly rules defined by the specified AAL type. It multiplexes ATM cells as per the user specified VPI/VCI/AAL type into CPS or SAR frames. ATM cells not satisfying the user specification will be reassembled as per the default specification.
Call Detail Record & Statistics View
Screen Shot of Statistics Window
Important call specific parameters like Call ID, Call disposition, Call duration, VPI/VCI, Call type (point-to-point/point-to-multipoint etc) calculated based on UNI signaling messages are displayed in Call Detail Record View. Additionally, users are provided with the option to search a particular call detail record from the captured traces.
Statistics is an important feature available in ATM analyzer and can be obtained for all frames both in real-time as well as offline mode. Various statistics can be obtained in Statistics View to study the performance and trend in the ATM network based on protocol fields and different parameters.
Enhanced Trace Saving Options
Screen Shot of Enhanced Trace Saving Options Window
Users can control the captured trace files by saving the trace using different conventions such as trace files with user-defined prefixes, trace file with date-time prefixes, and slider control to indicate the total number of files, file size, frame count, or time limit. This feature also allows the captured frames to be saved into a trace file based on the filtering criteria set using display filter feature.
Save/Load All Configuration Settings
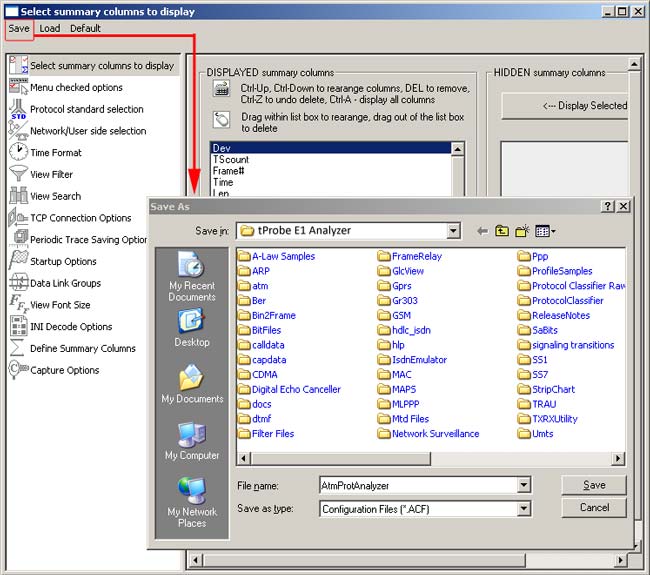
Screen Shot of Save/Load All Configuration Settings Window
Protocol Configuration window provides a consolidated interface for all the important settings required in the analyzer. This includes various options such as protocol selection, startup options, stream/interface selection, filter/search criteria and so on. Any protocol field can be added to the summary view, filtering, and search features from this GUI providing the users more flexibility to monitor required protocol fields. All the configuration settings done can be saved to a file and then loaded from a configuration file. Users may also just revert to the default settings using the default option.
ATM Emulation Tools
ATM IMA Emulation using Client-Server
GL's IMA (Inverse Multiplexing over ATM) Emulator is available as optional client-server based application with GL's T1 E1 Analysis hardware. The IMA Emulator application can simulate the inverse multiplexing of an ATM cell stream over multiple physical links ( up to 16 T1 E1 ports) and retrieve the original stream at the far-end from these physical links. For more information, visit ATM IMA Emulator webpage.
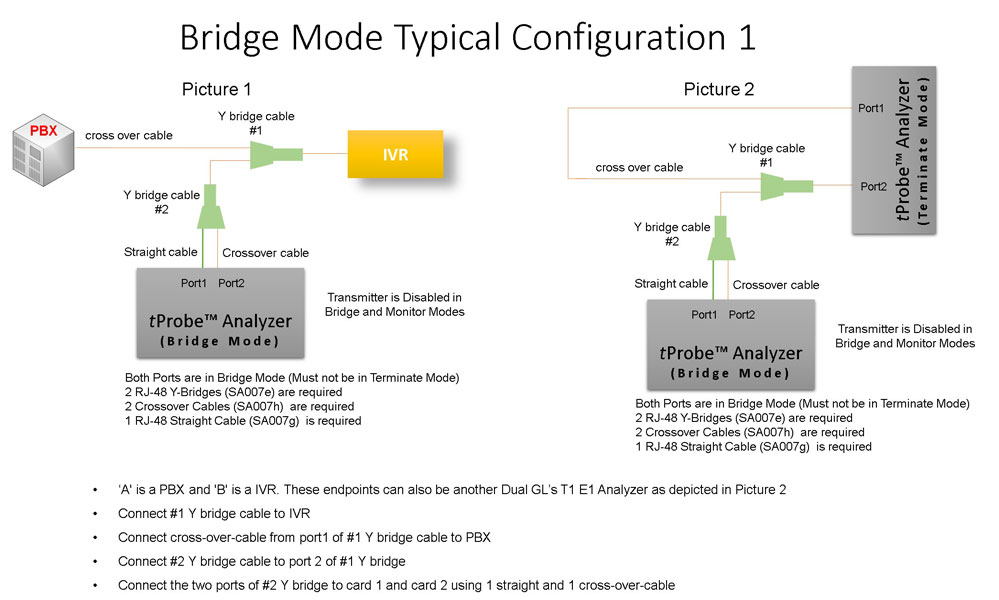
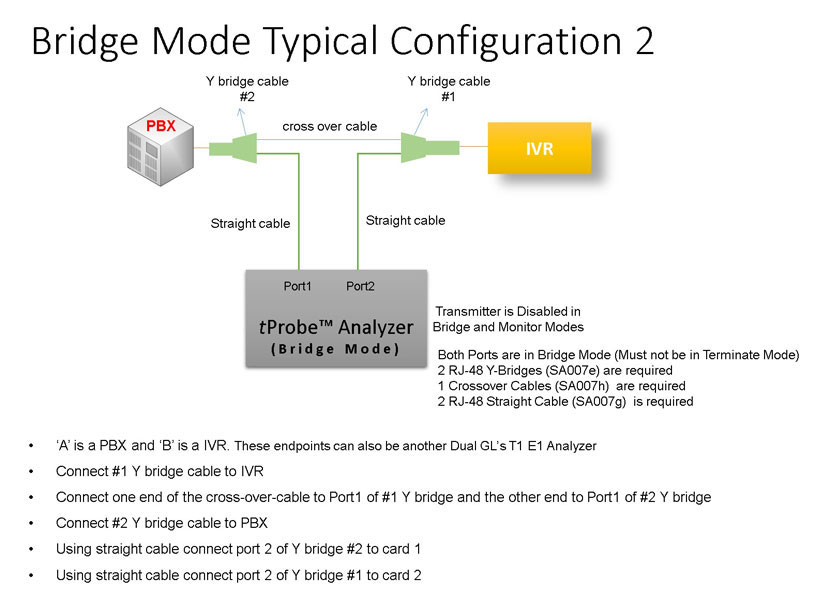
Bridge and Monitor Connections
- Monitor from a DSX-Patch Panel
- Bridge Mode Connections for Monitoring T1 E1 Signals for RJ-45
- Bridge Mode Connections Alternative Method
- RJ-45 Connections
Resources
Please Note1: The XX in the Item No. refers to the hardware platform, listed at the bottom of the Buyer's Guide, which the software will be running on. Therefore, XX can either be ETA or EEA (Octal/Quad Boards), PTA or PEA (tProbe Units), depending upon the hardware.
| Item No. | Item Description |
| XX160 | T1 or E1 ATM Analyzer |
| OLV160 | Offline T1 or E1 ATM Analyzer |
| Related Software | |
|---|---|
| XX020 | Record/Playback File Application |
| XX051 | Synchronous Trunk Record Playback |
| XX120 | SS7 Analyzer |
| XX654 | ATM IMA Emulator |
| XX135 | Multi Link PPP Analyzer |
| XX135 | Multi Link PPP Emulator |
| XX130 | Multi Link Frame Relay Analyzer |
| XX655 | Multi Link Frame Relay Emulator |
| Related Hardware | |
| PTE001 | tProbe™ Dual T1 E1 Laptop Analyzer with Basic Analyzer Software |
| XTE001 | Dual T1 E1 Express (PCIe) Boards (requires additional licenses) |
| FTE001 | QuadXpress T1 E1 Main Board (Quad Port– requires additional licenses) |
| ETE001 | OctalXpress T1 E1 Main Board plus Daughter Board (Octal Port– requires additional licenses) |
| TE3001 | USB based T3 E3 Analyzer Unit |
| LTS105 | LightSpeed1000 Analyzer Unit for OC-3/STM-1, OC-12/STM-4 |
* Specifications and features subject to change without notice.
 Back to Protocol Analysis Index Page