SonetExpert™ Channelized Analyzer
Test Synchronous Optical Networking (SONET) and Synchronous Digital Hierarchy (SDH) networks carrying channelized TDM traffic.
Request a Demo / Quote Brochure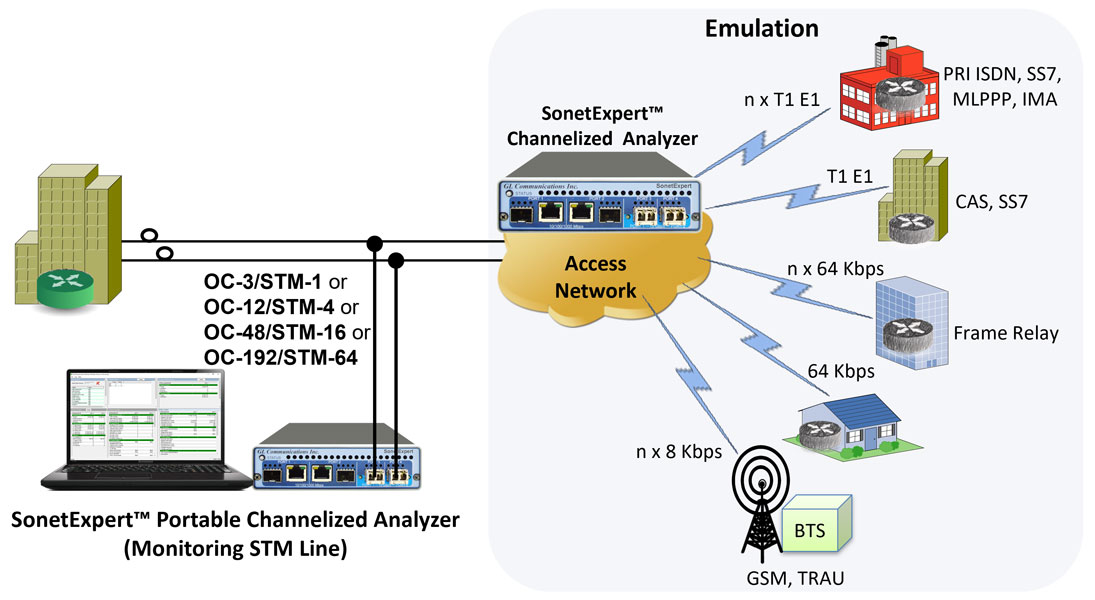
Overview
A majority of the backbone transport for voice, video and data applications continues to be Sonet and SDH optical transmission networks. Sonet and SDH transmission network also continue to be used for conventional channelized traffic – carrying many TDM T1, E1, T3, and E3 pipes.
GL’s SonetExpert™ portable hardware and application supports Sonet/SDH Emulation and Analysis:
- SonetExpert™ Channelized Emulation/Analysis for OC-3/STM-1, OC-12/STM-4
- SonetExpert™ Unchannelized Emulation/Analysis up to OC-192/STM-64
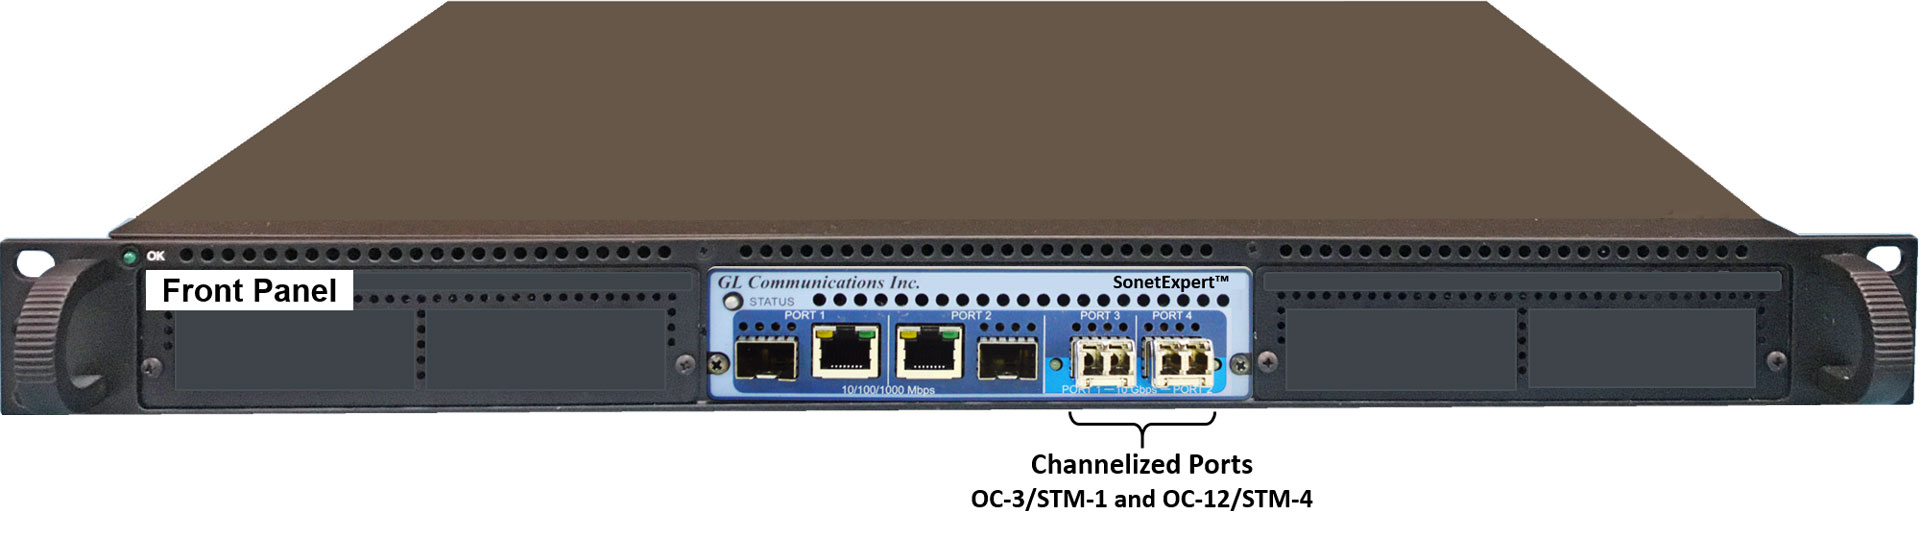
GL's SonetExpert™ hardware platform (USB Unit) is capable of OC-3/STM-1 and OC-12/STM-4 wirespeed processing on two optical ports (Port 1 and Port 2) for channelized data carrying many independent unframed/framed T1 and E1 streams. USB 3.0 interface is used to connect with a Notebook PC for portability. The hardware is FPGA based making it easy to upgrade in the field for application versatility. A unique feature of the unit is the capability to capture, transmit and process at wirespeed to/from applications on all interfaces. Also, can save the captured traffic to the hard disk and playback.
In an OC-3/STM-1, all 84 T1s or all 63 E1s can be identified and processed in transmit and receive modes. In an OC-12/STM-4, all 336 T1s or all 252 E1s can be identified and processed in transmit and receive modes.
Channelized Analyzer comprises of hardware and software. The hardware receives and transmits data using Sonet/SDH traffic which transfers the traffic in to the GL's Soft T1 E1 Analyzer (STEA) application. The T1 E1 Analyzers application provides the same functionality as GL hardware based T1 E1 Analyzers with the difference that T1 E1 frames are multiplexed into Sonet/SDH frames and transmitted over optical lines.
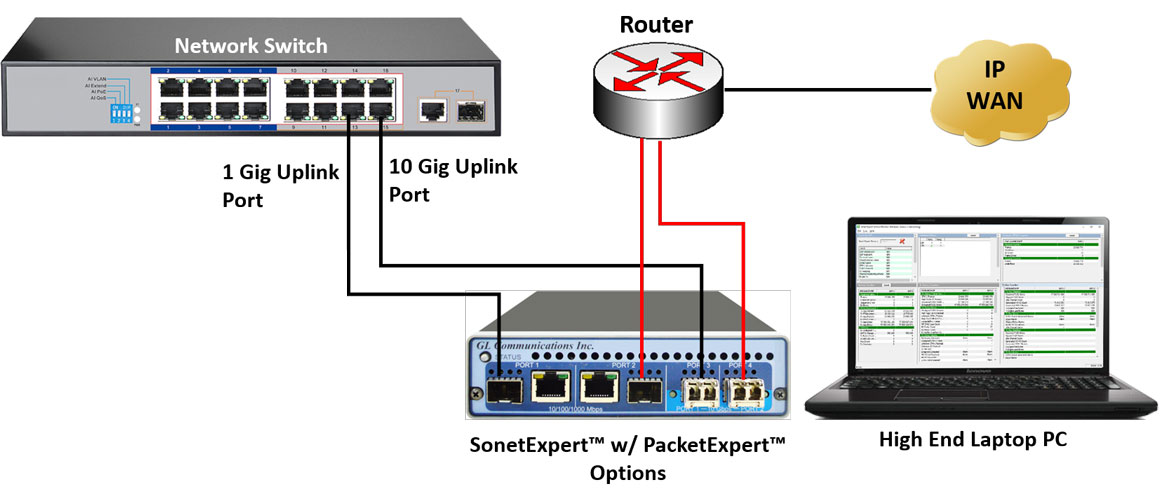
With the additional licenses SEU110 and SEU120, SonetExpert™ can be used to perform Ethernet/IP testing along with Sonet/SDH testing.
GL's SonetExpert™ Unchannelized Analyzer is capable of Sonet/SDH testing over OC-3/STM-1, OC-12/STM-4, OC-48/STM-16 and OC-192/STM-64 transports. It is based on the PacketExpert™/SonetExpert™ hardware platform. Packetexpert™/SonetExpert™ is a versatile hardware platform that supports both Ethernet (up to 10G) and Sonet/SDH (up to OC-192/STM-64) testing, two ports support Sonet/SDH testing.
For more details on Ethernet/IP testing, visit: PacketExpert™- Multi-Functional Ethernet/IP Test Solution.
Main Features
- Supports switching between Sonet and SDH terminologies
- Allows direct access to everything on Sonet / SDH – Framing and Payload, including structured traffic (T1, E1, STS-3, STS-12)
- Analyze or emulate voice, data, fax, protocols, analog and digital signals, including echo and voice quality
- Pluggable SFPs allow Single-mode (SM), and Multi-mode (MM) fiber optic non-intrusive tap
- Comprehensive protocol analysis and emulation - HDLC, SS7, ISDN, CAS, PPP, Frame Relay, ATM, UMTS, and more
- Capture and transmit at wirespeed to/from hard disk on all interfaces
- Capture traffic for off-line analysis and playback the captured traffic
- T1 E1 Analysis and Simulation:
- 2x channelized OC-3/STM-1, OC-12/STM-4 Sonet/SDH interfaces per SonetExpert™ for simulating and monitoring in both directions
- Configure the number of T1 E1 channels to be multiplexed or demultiplexed to/from OC-3/STM-1 or OC-12/STM-4
- Broadcasts the selected T1 E1 channel data on all the 252 E1’s or 336 T1’s
- Direct access to any or all T1s and E1s
- 2 x 336 T1’s x 24 DS0s = 16,128 DS0s
- 2 x 252 E1’s x 31 DS0s = 15,624 DS0s
- Provides Loss of Signal and Loss of Frames hardware alarms indication, Service logging, External Clock, Line and Diagnostic Loopback options, Through mode and Port Swap Cross-port options
- Broadcasts the selected T1 E1 channel data on all the 252 E1’s or 336 T1’s
- Supports any combination of DS0/64/56/16/8 kbps fractional T1 E1, and N x T1 E1 interface definitions (a total of 252 E1s or 336 T1s – in each port)
- Supports multiplexing multiple T1 or E1 channels to a single channelized OC-3/STM-1 or OC-12/STM-4 lines
- User configurable OC-3/STM-1 or OC-12/STM-4 mapping – allows user-defined T1 and E1 channels to multiplex. The channel numbering is same as in demultiplexer
- User configurable idle code to fill the channels when the user added channels do not have data to multiplex
- Provides an option to restart the SEC service automatically
Hardware Specifications
SonetExpert™ Portable Hardware Unit
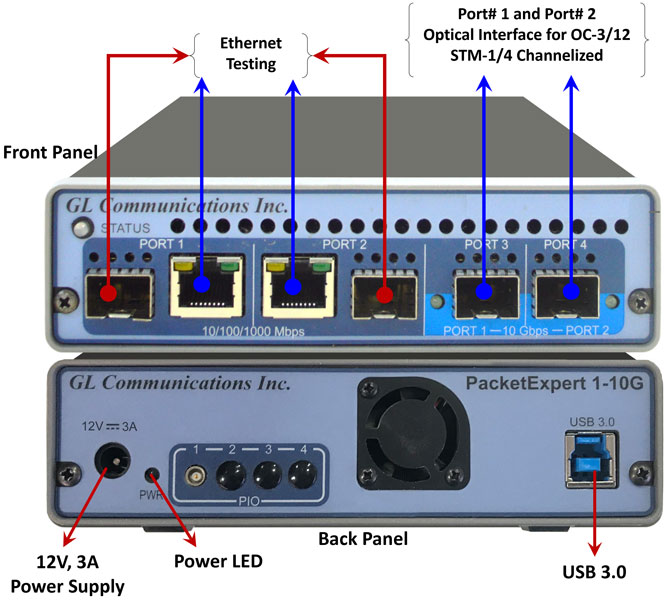
SonetExpert™ Hardware Unit
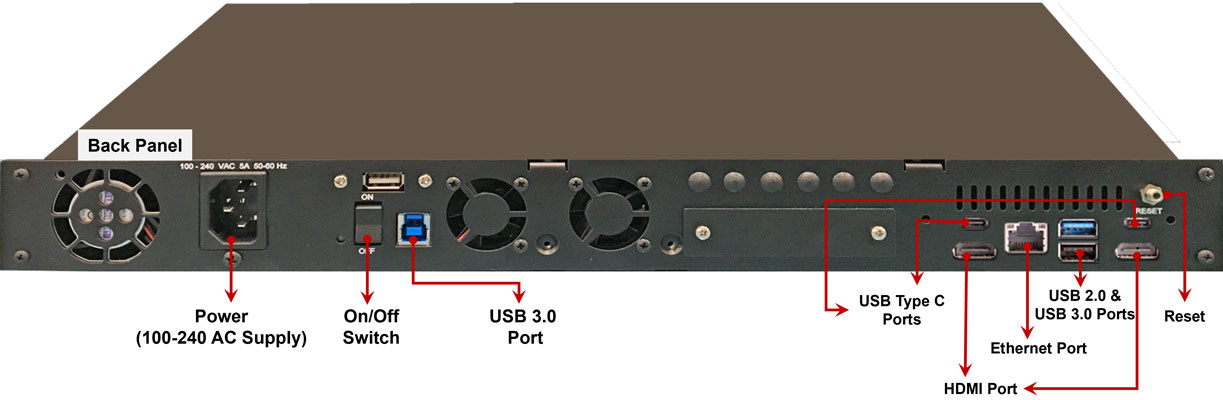
(Front and Rear Panel View)
SonetExpert™ with SFPs Configuration
SonetExpert™ contains 4 ports, out of which two ports (Optical Port 1 and Port 2) are designated for Sonet/SDH channelized data carrying many independent unframed/framed T1 or E1 streams.
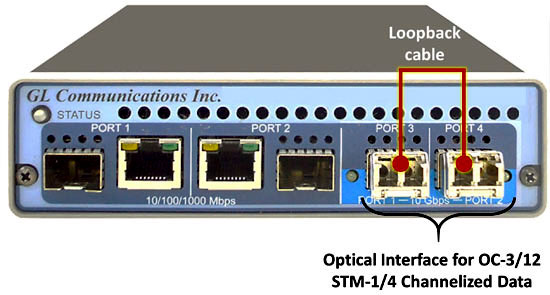
Connecting the optical SFPs to the fiber optic ports, the 2 ports (Port 1, Port 2) on the unit are available for OC-3/ STM-1, OC-12/STM-4 channelized testing.
| Specifications |
|---|
Interfaces
|
T1 E1 Sync Loss, HDB3 Violation, Carrier Loss, Frame Error, Remote, Distant MF, AIS, BPV Errors, CRC Errors, Frame Errors, Transmit Under Run, Receive Over Run |
Power and Dimensions:
|
mTOP™ Packet/SonetExpert™ Probe
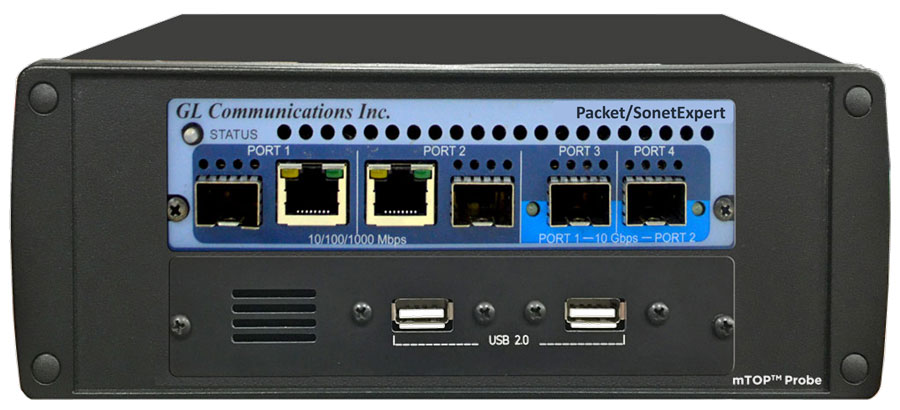
Packet/SonetExpert™ mTOP™ Probe
(Front Panel View)
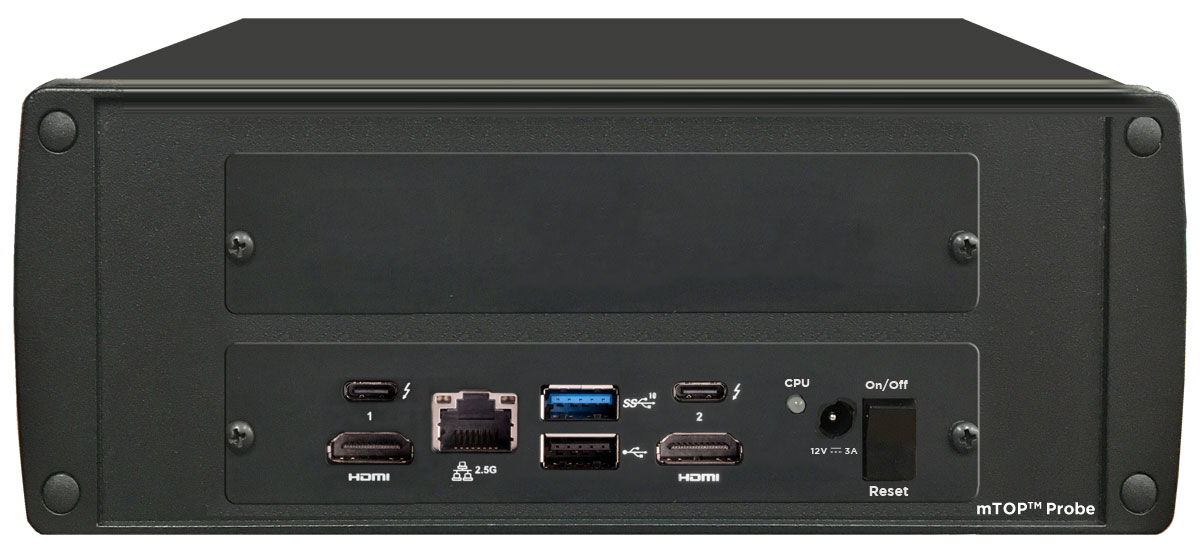
Packet/SonetExpert™ mTOP™ Probe
(Rear Panel View)
| Specifications |
|---|
Dimensions:
|
| Packet/SonetExpert™ interfaces
|
|
SBC specifications -
|
SonetExpert™ mTOP™ 1U Rack Solution
SonetExpert™ mTOP™ 1U rack solution
(Front Panel View)
SonetExpert™ mTOP™ 1U rack solution
(Rear Panel View)
| Specifications |
|---|
Dimensions:
|
SonetExpert™ interfaces (1 unit)
|
SBC specifications
|
Order information
|
The SEC comprises of hardware and software receiving and transmitting data using Sonet and SDH networks and communicating with the GL Soft T1 E1 Analyzer application. The GL's Soft T1 E1 Analyzer provides the same functionalities as GL hardware based T1 E1 Analyzers with the difference that T1 E1 frames are multiplexed into Sonet/SDH frames and transmitted over optical lines. The SEC architecture creates the appearance of a GL's Soft T1 E1 Analyzer seamlessly operating over Sonet/SDH lines similar to a hardware based T1 E1 Analyzer physically connected to multiple T1 E1 lines.
SEC software consists of:
- SEC service
- SEC monitor and control
- SEC configuration utility
- SEC logging facility
The service requires Administrator authority and is usually launched from the SEC monitor and control application. The service uses SonetExpert™ device to transmit and receive data over optical lines using Sonet/SDH protocols. The service demultiplexes T1 E1 frames received from the Sonet/SDH and sends them using User Datagram Protocol (UDP) to GL’s Soft T1 E1 Analyzer. It also multiplexes T1 E1 frames into Sonet/SDH frames and transmits over optical lines using SonetExpert™ hardware.
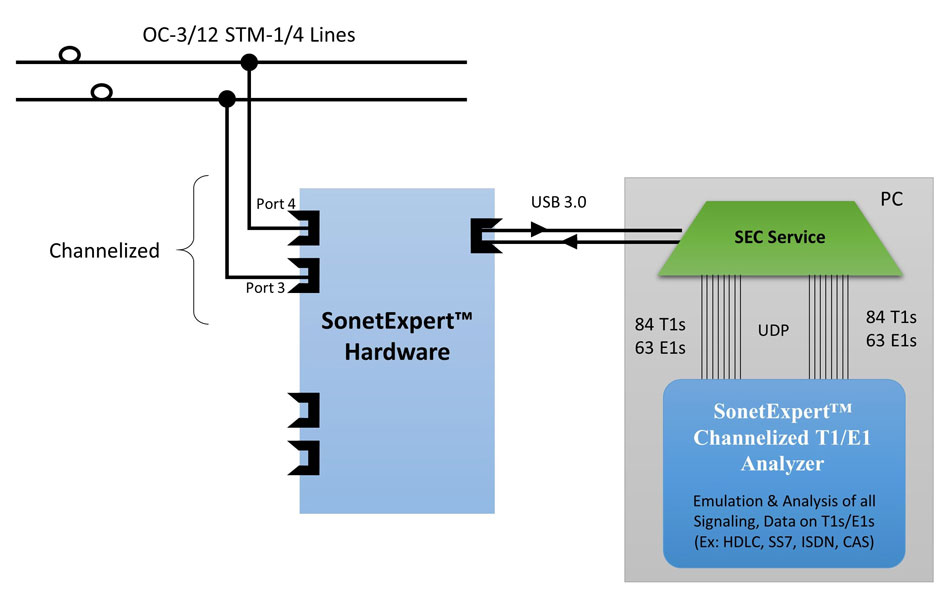
Architecture of SonetExpert™ Channelized Analyzer
When SEC Monitor and Control is running, it does not affect the functionality of the SEC service, the application just monitors the service. The latter is running undisturbed regardless SEC Monitor and Control application is up or it is closed. The monitoring features allow users to see the operational status of the service otherwise invisible. Users can open and close SEC Monitoring and Control application as many times as needed without disturbing operations. The only way to cause interference with the service operation is to invoke the “STOP SERVICE” function.
The picture below shows GUI based SonetExpert™ Channelized Analyzer Service Monitor, which provides users with the following functionality:
- Starting and stopping the SEC service
- Configuring the SEC service
- Launching Soft T1 E1 Analyzer
- Viewing and clearing the SEC service log
- Displaying alarms, error counters and operational statistics
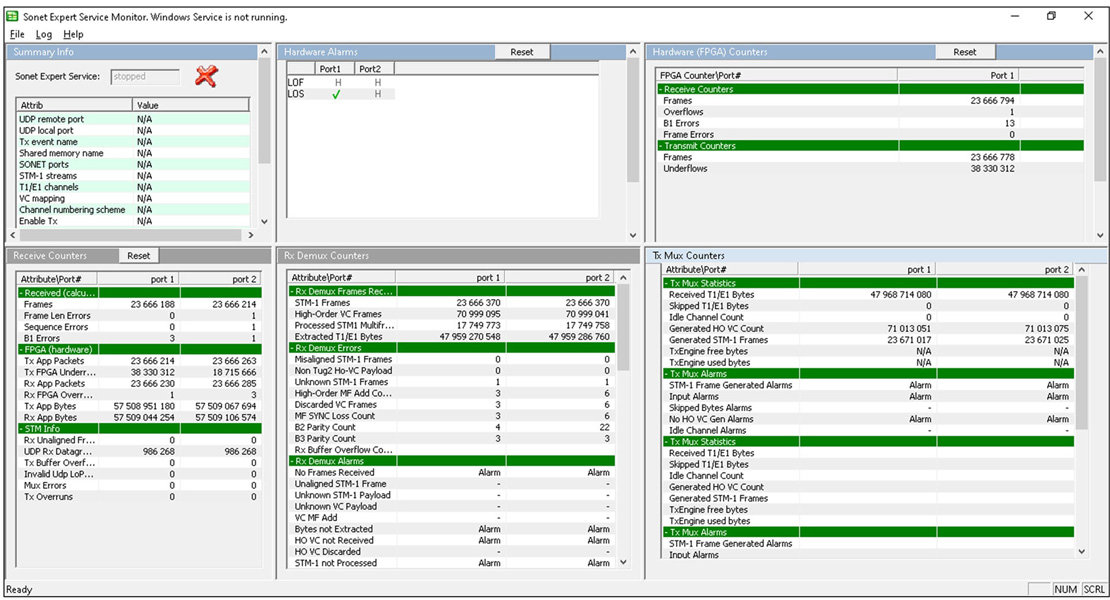
SEC Monitor and Control Window
SEC Configuration Utility
The utility configures Sonet/SDH parameters, UDP endpoints for T1 E1 frame data transfer between STEA and SEC services, T1 E1 channels used and clock setting of Sonet/SDH ports.
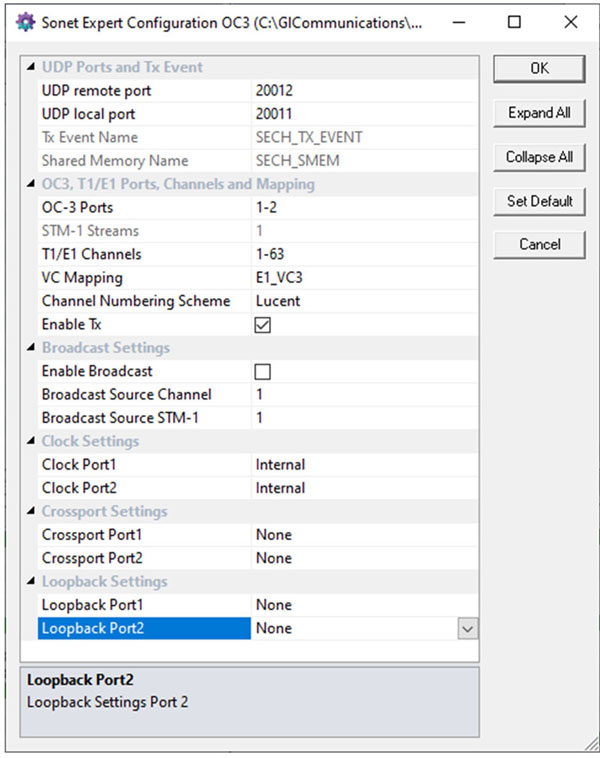
OC-3 Configuration Utility
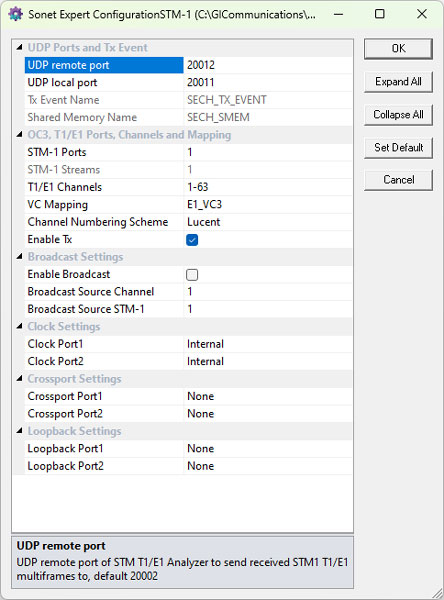
STM-1 Configuration Utility
Sonet/SDH Data Rates
Sonet is the North American standard (termed OC-N) defined in Telcordia GR-253-CORE and ANSI T1.105. STS-1 (Synchronous Transport Signal Level -1) is the basic level of electrically framed signal format in Sonet. Higher-level signals are integer multiples of STS-1, creating the family of STS-N signals, for N = 1, 3, 12, 48, 192 & 768. The optical counterpart for each STS-N signal is designated as OC-N (Optical Carrier Level-N).
SDH is the Asian and European standard (termed STM-N) defined in ITU G.707 and G.708 standard. An STM-N (Synchronous Transport Module Level-N) are the frame structures used in the SDH.
The following table details bit rates of Sonet and SDH.
| North American Standards | ITU-T Designation | |||||
| Electrical Level | Optical Level | Data Rate (Mbps) | Payload Rate (Mbps) | SDH Equivalent | T1 Equivalent | SonetExpert™ |
|---|---|---|---|---|---|---|
STS-1 |
OC-1 |
51.84 |
48.38 |
STM-0 |
28 T1s |
|
STS-3 |
OC-3 |
155.52 |
149.76 |
STM-1 |
84 T1s |
Yes |
STS-12 |
OC-12 |
622.08 |
599.04 |
STM-4 |
336 T1s |
Yes |
STS-48 |
OC-48 |
2488.32 |
2396.16 |
STM-16 |
1344 T1s |
|
STS-192 |
OC-192 |
9953.28 |
9584.64 |
STM-64 |
5376 T1s |
|
. |
. |
. |
. |
. |
. |
|
. |
. |
. |
. |
. |
. |
|
STS-3072 |
OC-3072 |
160Gbit/s |
|
STM-1024 |
86016 T1s |
|
SDH Signal Mapping
This configuration tells which mapping option should be used when multiplexing the T1 E1 channels from OC-3/STM-1. Sonet/STS-3/OC-3 maps to 84 T1 Ports. SDH/STM-1 maps to 63 E1 Ports. On the Rx path, the mapping of the received frames will be detected automatically, this configuration has effect only on the Tx path.
Two mapping schemes are supported for both T1 and E1.
The below diagram depicts various T1 E1 to STM-1/STM-4 signal mapping possibilities in SonetExpert™ Channelized Analyzer hardware.
- E1_VC3 (Mapping path E1 = STM-4 → STM-1 →AUG-1 → AU-3 → VC-3 → TUG-2 → TU-12→E1)
- E1_VC4 (Mapping path E1 = STM-4 → STM-1 →AUG-1 → AU-4 → VC-4 → TUG-3 → TUG-2→TU-12→ E1)
- T1_VC3 (Mapping path T1 = STM-4 → STM-1 → AUG-1 → AU-3 → VC-3 → TUG-2 → TU-11→ T1)
- T1_VC4 (Mapping path T1 = STM-4 → STM-1 → AUG-1 → AU-4 → VC-4 → TUG-3 → TUG-2→TU-11→ T1)
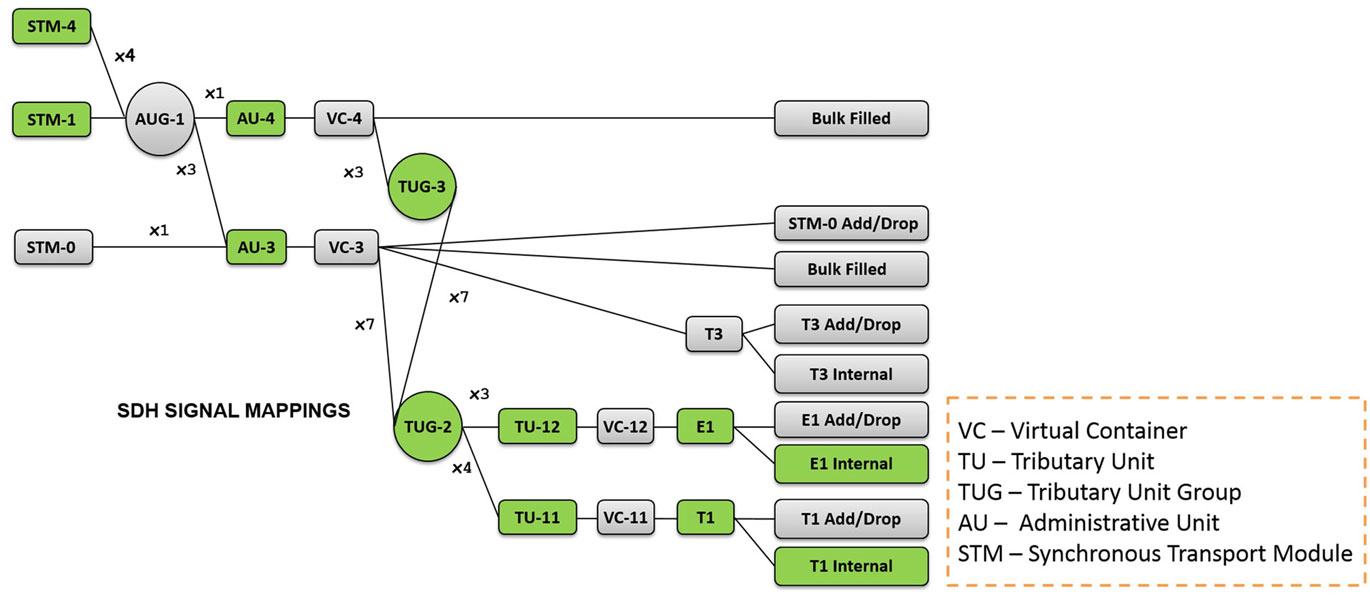
VC Mapping in GL’s SonetExpert™
Sonet Signal Mappings
The below diagram shows various T1 E1 to OC-12 mapping possibilities in Sonet. The paths colored in Green color are supported on GL’s SonetExpert™ hardware.
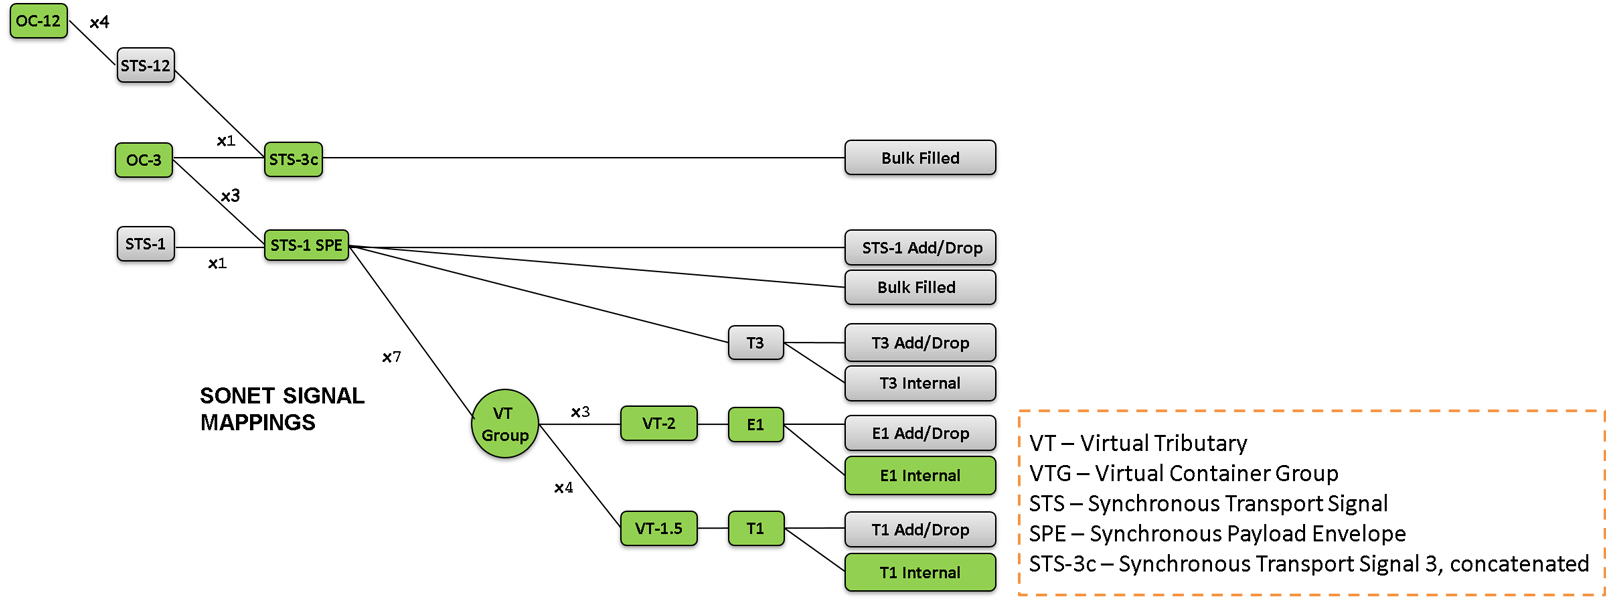
The T1 and E1 mappings for OC-12 in Sonet are as below:
- E1_VT2 (Mapping path E1 = STS-12 --> OC-12 --> STS-3 --> STS-1 --> VT-Group --> VT2 --> E1
- E1_VT2 (Mapping path E1 = STS-12 --> OC-12 --> STS-3c --> STS-1 --> VT-Group --> VT2 --> E1
- T1_VT1.5 (Mapping path E1 = STS-12 --> OC-12 --> STS-3 --> STS-1 --> VT-Group --> VT1.5 --> T1
- T1_VT1.5 (Mapping path E1 = STS-12 --> OC-12 --> STS-3c --> STS-1 --> VT-Group --> VT1.5 --> T1
Accompanying Basic Software / Features
Almost all the basic applications and optional applications supported by T1 E1 analyzers are also supported by SonetExpert™ Channelized Analyzer. For example, capturing and transmitting an entire OC-3/STM-1 or OC-12/STM/4 signals simultaneously, or performing ISDN, or SS7 analysis, can be performed using the software accompanying the SonetExpert™ Channelized Analyzer.
A list of all the basic applications and other optional applications (requiring additional licenses).
Some of the applications currently supported are discussed below -
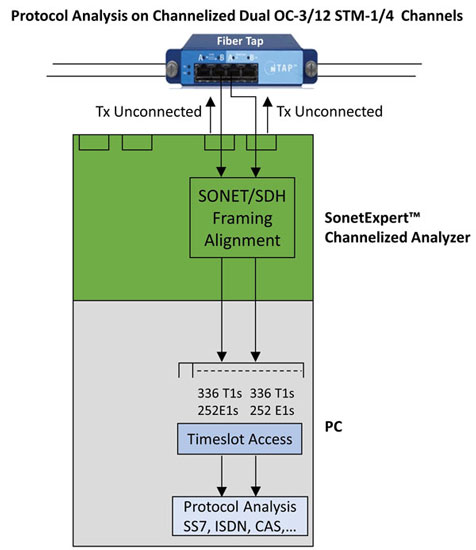
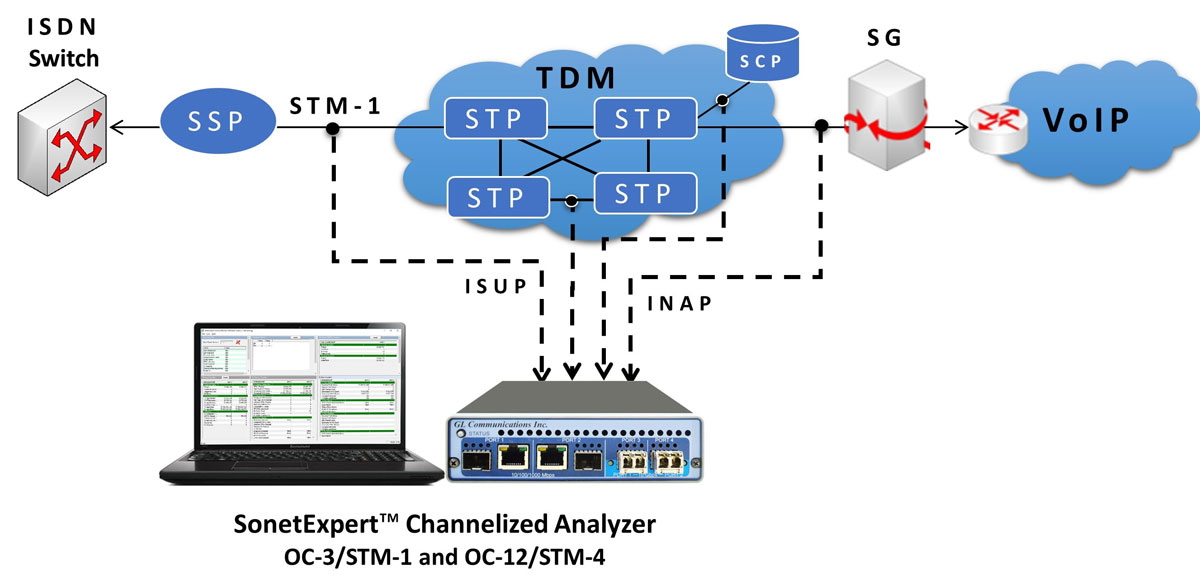
Application #1: Protocol Analysis
The protocol analysis can be performed on the packets captured non-intrusively by connecting the channelized Rx Ports of SonetExpert™ to a Fiber Optic tap - as shown below. The SonetExpert™ is capable of selectively identifying and forwarding the T1, or E1 signals from OC-3/STM-1 or OC-12/STM/4 signal streams to GL’s wide variety of protocol analysis modules such as SS7, ISDN, CAS, and more.
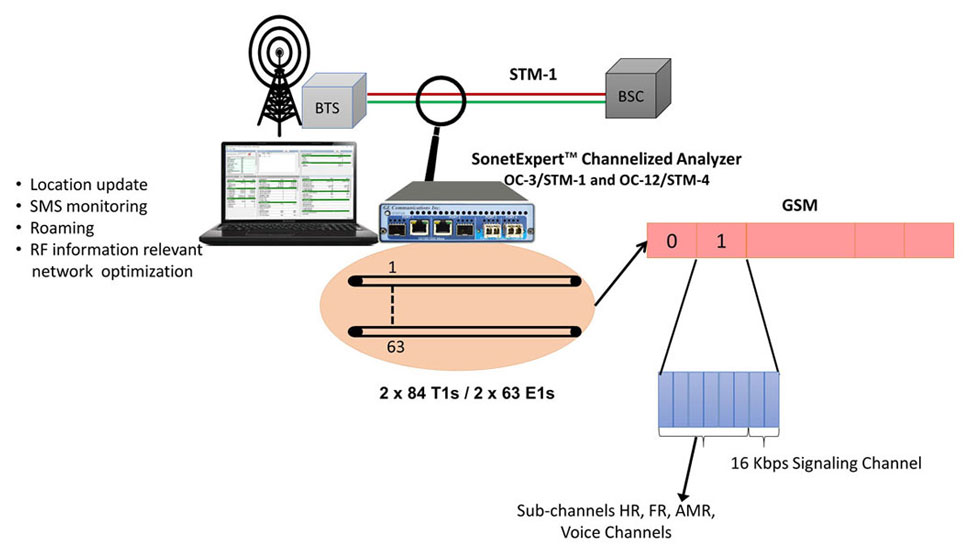
Application #2: Abis Monitoring
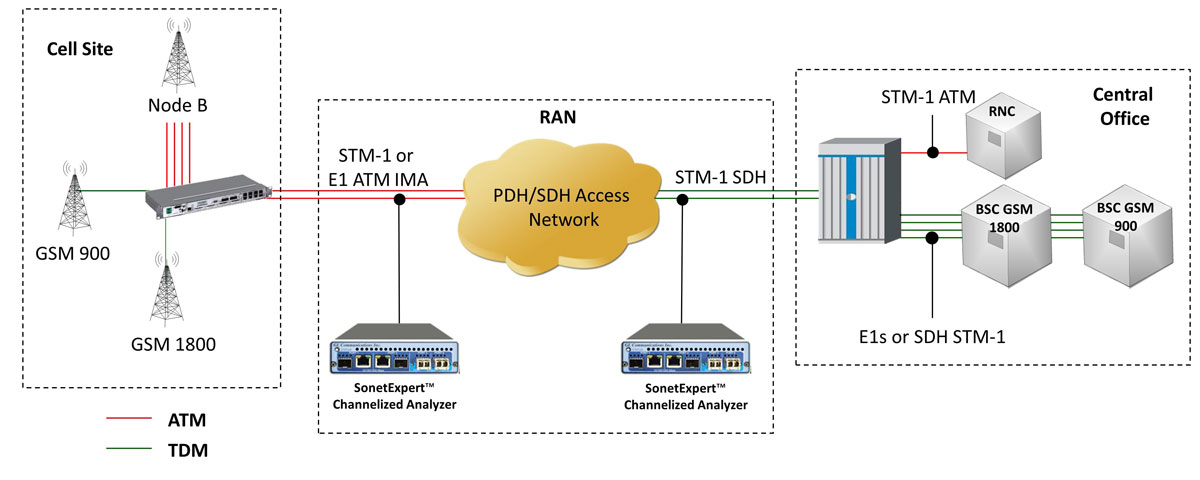
Application #3: ATM to SDH in a 3G GSM Network
Application #4: Portable Test Solution for TDM, SDH, Packet, and Analog
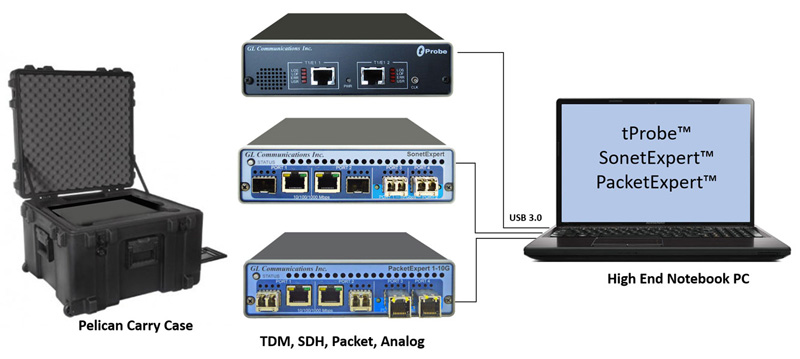
Solution 1 : tProbe™ + SonetExpert™ + PacketExpert™
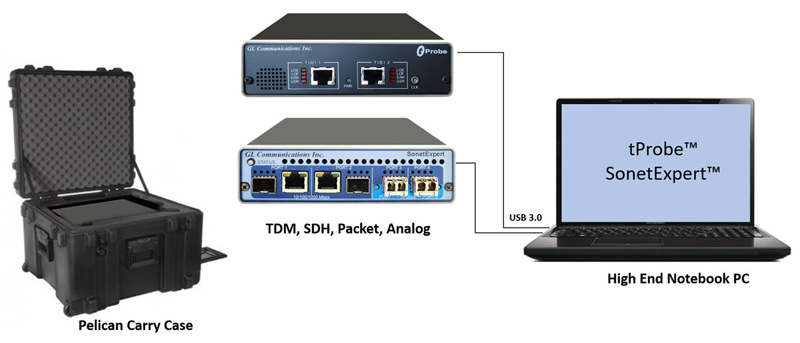
Solution 2 : tProbe™ + SonetExpert™
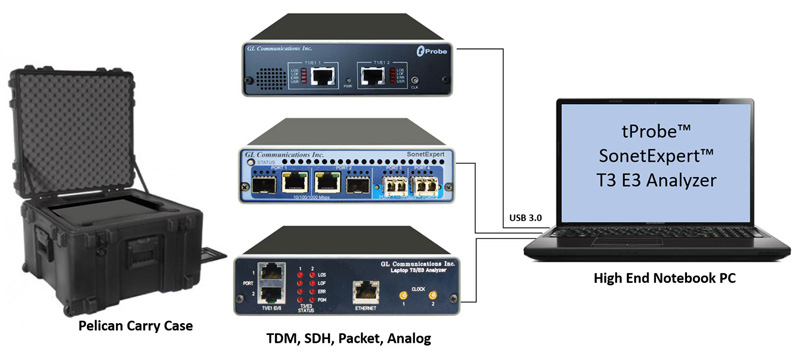
Solution 3 : tProbe™ + SonetExpert™ + T3 E3 Analyzer
Application #5: Monitoring and Analysis of TDM and IP Network

Basic Applications (Included with T1 E1 Basic Software
T1E1 Line Interface Options
Provides options for configuring Framing formats and Encoding option.
Framing Formats
- For T1 systems supports the following framing formats: 193S (D4) Framing Format and 193E (ESF) Framing Format
- For E1 systems supports the following framing formats: Channel Associated (CAS), Common Channel Signaling (CCS), and Unframed Mode for E1
Encoding Options
The companding (A and µ) laws are used for Audio level compression, which is used for many purposes as explained below:
The mu-law algorithm (µ-law) is a companding algorithm, primarily used in the digital telecommunication systems of North America and Japan. It is similar to the A-law algorithm used in Europe. The default encoding used by T1 is Mu-Law (µ-law).
An a-law algorithm is a standard companding algorithm, used in European digital communications systems to optimize, i.e., modify, the dynamic range of an analog signal for digitizing. The default encoding used by E1 is A-La
Monitoring Applications
The T1 (E1) analyzer boards provides in-service monitoring of T1 (E1) circuit connections, alarms, frame errors, sync loss, bipolar violation signals, including received frequency, received signal level, data bytes, and DC offset. Also included are applications such as oscilloscope and spectral display to graphically analyze signals. The T1 (E1) analyzer boards emulates and decodes all 24 (32) channels simultaneously for Signaling Bits, Power Level, Frequency, and Multi-Frame Data. VF interface for monitoring and inserting audio with Drop and Insert are also provided.
Monitor T1/E1 Line Status
This application displays the T1/E1 line conditions for all the T1/E1 ports. You can monitor line sync loss, HDB3 violation, carrier loss, frame error, distant MF, alarm indication signal (AIS) and ES overflow/underflow in case of E1, and line sync loss, BPV, carrier loss, frame error, blue alarm, yellow alarm, alarm indication signal (AIS) and ES overflow/underflow in case of T1. Additionally, the application allows users to monitor the T1/E1 line conditions such as frequency, the power level and clock (or frame/bit slips) slips.
Extensive Use of Graphics for Rx Signal Monitoring
Bytes Values Display for all time slots
This box displays the data values for each time slot in HEX data format. These values will be changing very rapidly, as each timeslot's data rate is 8000 bytes/sec.
Binary Byte Values Display for all time slots
This box displays the data values for each time slot in binary data format. These values will be changing very rapidly as each timeslot's data rate is 8000 bytes/sec.
Monitor signaling bits
The signaling bits associated with each timeslot are displayed in real-time.
- For T1 cards, the received signaling bits A and B for 193S (D4 Framing
- Format) and A, B, C, and D for 193E (ESF Framing Format) are displayed for all channels
- For E1 Cards, this application should be used in CAS mode only
- The signaling bits A, B, C, and D are displayed for all channels. These bits are demultiplexed from timeslot 16
Power Level Display for all time slots
The rms (root-mean-square) value of the digital codewords (after expansion from µ-Law or A-law) for each timeslot is computed and continuously displayed in dBm. The number of samples used in the computation is 192.
DC Offset Display for all time slots
The DC Offset application provides the capability to measure and display DC offsets for all timeslots. Multiple instances of this application may be opened simultaneously to monitor DC offsets on more than one GL card.
Frequency Display for all time slots
A continuous display of the signal frequency in each timeslot is displayed. The frequency is computed using the zero-crossing rate of the samples from each channel. The number of samples used in the calculation is 4000.
Multiframe Byte Display
This application permits viewing of complete multiframes. Approximately one second of data is captured, or 682 multiframes in T1 ESF/193E, 1364 multiframes in T1 D4/193S, 1024 multiframes for E1. The data is displayed with each frame identified. For T1 systems, twelve (12) frames are displayed per multiframe in D4 (193S) framing format, and twenty-four (24) frames in ESF (193E) framing format. For E1 systems, 16 frames are displayed per multiframe.
Real Time Multiframe Monitoring
This application permits viewing of multiframes in real-time. The data is refreshed for about every second. For T1 systems, twelve frames are displayed per multiframe in D4 (193S) framing format. Twenty-four (24) frames are displayed in ESF (193E) framing format. For E1 systems, 16 frames are displayed per multiframe.
Real Time Bitmap Monitoring
This application permits a graphical view of complete multiframes as a real-time bitmap. A snapshot of several multiframes of data is obtained at a given instance and the view is rendered as a pixel map with zeros represented by white dots and ones represented by black dots.
Time Slot Byte Display
This window displays the timeslot value for about '1' second duration for a desired timeslot. Ability to change the particular timeslot is also provided. "New Buffer" button allows refreshing of the data. The "Timeslot Window" module differs from "Multiframes" module, in which all the multiframes for a particular timeslot are displayed.
Data of about one-second duration is displayed. In "Multiframes",
T1 D4/193S: 1364 multiframes are displayed
T1 ESF/193E: 682 multiframes are
displayed
E1: 1024 multiframes are displayed
ASCII Timeslot Display
This application permits viewing of real-time ASCII events that are present on the T1 or E1. The ability to display the ASCII events for a particular port and timeslot is provided. Each event is properly time-stamped for tests that require time correlation. Logging real-time events to the hard drive is also possible; this is useful during overnight or long-term testing.
Real Time Oscilloscope Display of DS0
The PCM codes (amplitude of the incoming signal) of any selected timeslot are displayed in real-time graphically as a function of time. Timeslot selection and time base can be changed either to view different incoming timeslots or modify the duration of the display. The time base can be adjusted from approximately 0.005 sec full scale to 1.000 sec full scale. This application can be used to visually assess activities on the channel such as noise, tone, speech, etc. The data may be displayed for all signaling formats – alaw, mulaw, pcm16, pcm13, pcm14, pcm8, and different byte order for INTEL (Little Endian), and MOTOROLA (Big Endian).
Real Time Power Spectral Display of DS0
The data received on a specified timeslot can be viewed in the spectral domain (spectral amplitude Vs frequency). A Fast Fourier Transform (FFT) is applied to successive sample sets of the incoming data and displayed in graphically. Adjust the frequency resolution by the FFT length (from 32 points to 8192 points). The data can be smoothed to lessen the effects of truncation by applying Hamming, Hanning, Harris, Blackman, Triangular, or Rectangular filter windows.
Audio Monitoring
Audio monitoring allows the control of VF output (speakers) of all T1/E1 cards connected to a PC under a single program. This application permits the combined display of all T1/E1 cards speakers in the PC and thereby facilitating the user a single application for all speaker controls.
Active Voice Level Monitoring
The Active Voice Level Monitor computes the Active Voice Level of a signal according to the ITU-T P.56 specification, Method B. This analyzes the source signal in real-time from T1/E1 timeslots, or process the captured signal data files offline. This application is available under the Monitor Menu in T1/E1 analyzer software.
Pulse Mask Compliance Testing (Available only with tProbe™ and Universal HD T1 E1 cards)
In T1 E1 transmission systems, signals are dropped, inserted, and accessed at the electrical level at a point called DSX patch panel or at some similar point. To reliably receive, monitor, or access these signals, they must first conform to a standard that establishes parameters such as pulse width, rise time, amplitude, allowable undershoot and overshoot. If the pulse meets the pulse mask, then a properly designed receiver should be able to decode the bits transmitted.
GL's Universal T1 E1 Cards provides pulse mask compliance testing using Pulse Mask Display for both T1 and E1 applications. Software has been developed to determine if the pulse shape fits within a "pulse mask" as specified by standards ITU G.703 and ANSI T1.102-1993. The software is available in both visual and tabular formats. Tabular formats are convenient for automation and scripted test environments.
Jitter Measurement (Available only with tProbe™ and Universal HD T1 E1 cards)
Jitter along with wander and frequency drift are major impairments of clocks in synchronous systems. Jitter is the time discrepancy between the time of arrival of a clock pulse and its theoretical arrival time. GL's Jitter Measurement module allows evaluation of jitter on either a tick-by-tick or a cumulative basis. Cumulative jitter is of primary importance as network equipment must cope with the cumulative jitter by the use of appropriately sized “jitter buffers”. Tick-by-tick measurements provide instantaneous jitter.
Real-time strip chart software
Real-time Strip Chart option allows users to capture and analyze signaling as well as PCM data captured at a specified timeslot.
Real-time Multi-Channel Audio Bridge
The Multi-Channel Audio Monitor is an optional (XX017) application available with the T1/E1 Analyzer. Audio monitoring application allows users to insert speech on T1/E1 lines using microphone and listen to the speech on T1/E1 lines using speaker (requires internal or external sound card to be connected to the PC).
The speech can be inserted or extracted on selected T1/E1 card, channel and sub channel. It supports A-law, Mu-law, G.726 40 Kbps, 32 Kbps, 24 Kbps, and 16 Kbps data rates. Optional Mono and Stereo audio modes are also available.
Capture Dialed Digits (DTMF / MF/ MFR2-f/ MFR2-B Detection)
The Capture Dialed Digits application provides the capability to capture and display DTMF and MF (along with MFR2-forward and MFR2-backward) digits as they are received on one or several time slots.
Signaling Transitions Recording
This optional software provides time-stamped indications of all signaling bit changes. The application works with one or multiple Ultra T1/E1 Cards or with the Single or Dual USB T1/E1 Analyzers. Signaling bit changes are recorded for all timeslots simultaneously
Intrusive Testing Applications
A variety of standard data patterns including static and user defined patterns are available for intrusive testing purposes. The Software Delay Measurement under basic software measures the delay by tracking a byte mark's transmission and reception timestamps using precise computer time. Tone / Multiframe / Noise generation, signaling bit manipulation, including error insertion features provide complete signaling ability for T1 E1 analyzer.
Transmit Tone, Transmit Gaussian Noise, User-defined Multiframe, Signaling Bits
Transmit Tone / Multiframe / Noise generation and detection, signaling bit manipulation and recording, including error insertion features provide complete signaling ability for T1/E1 analyzer.
Rx-to-Tx Loopback
The Tx Rx Loopback application is only for diagnostic purposes. It loops all the receive data from all timeslots back to the transmitting port. It is used in conjunction with a Bit Error Rate Test to verify the operation of Cards and USB units.
Precision Loopback and Broadcast
The Precision Loopback and Broadcast Interface enables data transmission from an Rx port to one or multiple Tx ports with configurable timing and safety margins. It ensures accurate loopback while monitoring delays, data availability, and overruns.23-Tone Test Director (Tx) and Responder (Rx).
The 23-Tone Test is a diagnostic tool used to evaluate the performance of communication channels. It consists of two main components: the Test Director (Tx) and the Test Responder (Rx). The Test Director transmits 23 distinct tones, while the Test Responder receives and analyzes these tones to assess signal integrity, frequency response, and channel impairments.
Software Delay Measurement
The software delay measurement utility operates in both hardware and software-based T1 E1 analyzers, measuring delay by tracking a byte mark's transmission and reception timestamps using precise computer time.
Resources
Note: PCs which include GL hardware/software require Intel or AMD processors for compliance.
| Item No | Item Description |
| SEUE02 | SonetExpert™ Channelized Analyzer (OC-3/STM-1) |
| SEUT02 | SonetExpert™ Channelized Analyzer (OC-12/STM-4) |
| SEE001 |
SonetExpert™ OC-3/STM-1 Basic E1 Software |
| SET001 | SonetExpert™ OC-3/STM-1 Basic T1 Software |
| Optional Applications | |
|---|---|
| SEU110 | SonetExpert™ Upgrade to PXN100 |
| SEU120 | SonetExpert™ Upgrade to PXN101 |
| PXN100 | PacketExpert™ 10GX |
| PXN101 | 10G option for PXN100 |