Multi Stream Traffic Generator and Analyzer
Ethernet tester capable of generating multi-stream UDP/TCP Ethernet traffic of varying packet length and also analyzes the received traffic.
Request a Demo / QuoteBrochure sample Report
Overview
Multi Stream UDP/TCP Traffic Generator and Analyzer is a hardware-based Ethernet tester capable of generating multi-stream Ethernet traffic of varying packet length and also analyze the loopback traffic. It has the capability to Generate and Analyze up to 16 UDP streams of traffic of various packet lengths. This tool finds itself especially useful for end-to-end testing of 1 Gbps and 10 Gbps WAN (Wide Area Network) links.
Multi Stream UDP/TCP Traffic Generator and Analyzer (PXE108, PXN108) is available on the following PacketExpert™ platforms -
- PacketExpert™ 1G (PXE100) - This is a quad port USB based portable unit, of which 2 ports are of 10/100/1000Mbps Electrical or Optical (Port 2, Port 3), and other 2 are 10/100/1000Mbps Electrical only. Multi Stream Traffic Generator and Analyzer licensed PXE108 generates multi-stream (12 streams on 1G ports) Ethernet traffic, which is transmitted on Port#2 and is loopback on Port#3. The received traffic at port#2 is analyzed and along with FLR, IR, FTD, FDV result measurements individual result FLR, IR, FTD, FDV graphs are also provided.
- PacketExpert™ 10GX (PXN100) - This is a quad port USB based portable unit, of which 2 are 10/2.5/1 Gbps optical/electrical ports, and other 2 are 10/100/1000Mbps Electrical/Optical ports. The 10Gbps ports can be down-shifted to support 1Gbps Electrical ports, thus offering all four 1 Gbps ports for ethernet testing. Multi Stream UDP/TCP Traffic Generator and Analyzer licensed PXN108 generates multi-stream (16 streams on both 1G and 10G ports) Ethernet traffic, which is transmitted on 10G/2.5G/1G: Port#1 and is loopback on 10G/2.5G/1G: Port#2. The received traffic at 10G/2.5G/1G: Port#1 is analyzed and along with FLR, IR, FTD, FDV result measurements throughput graph is also provided.
The portable unit is suitable for field testing; while the compact design of the unit allows to easily deploy multiple such units in the rack enclosure providing high-density form factor solution.
The test results include Frame Loss, Frame Delay and Frame Delay Variation metrics for each stream. Easily monitor the bandwidth performance using live throughput consolidated graphical view for all the configured streams.
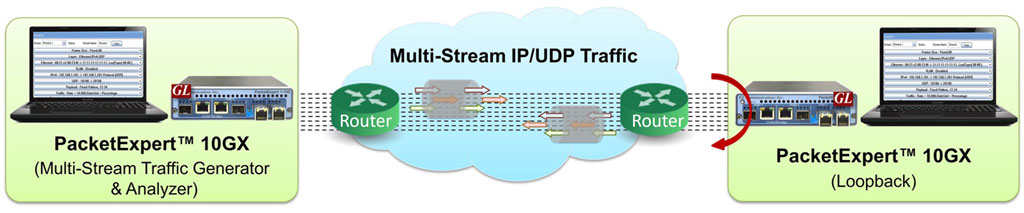
As depicted in the network diagram above, multiple streams are generated as per the user defined configurations - MAC/VLAN/IP/UDP header, the rate and the frame size. Based on the Frame size, and Rate configured different classes of traffic (voice, video, data, etc) can be prioritized.
The loopback ports on PacketExpert™ offers Smart Loopback functionality on both 10G/1G to loopback the incoming traffic back to the source in the network. Loopback option helps in easy test setup, especially in end-to-end testing, when the other end is in a remote place. In such cases, one PacketExpert™ can be put in constant Loopback at the remote end, and tests can be controlled at the local end.
Other important functionalities included on PacketExpert™ platforms are as follows:
- Wire speed BERT
- Smart Loopback
- RFC 2544 Testing
- Record and Playback
- PacketBroker
- IPNetSim™ - IP WAN Link Emulator
- IPLinkSim™ - IP WAN Link Emulator
- Y.1564 Testing – ExpertSAM™
- Multi Stream Traffic Generator and Analyzer
- ExpertTCP™ - (Available with Multi Stream Traffic Generator Analyzer)
PacketExpert™ also supports Command line Interface (CLI) to access all the above listed functionalities remotely using Python, C# clients and MAPS™ CLI Client/ Server architecture.
Features
- Test tool with both Ethernet traffic generation and analysis capabilities in one-box
- Generate and analyze packets at 1GigE and 10GigE line rates, with zero packet loss
- On 10G units (PXN100) 16 multiple streams are generated on both 1G and 10G ports
- On 1G units (PXE100) 12 multiple streams are generated on 1G ports
- Frame Length - Support for frame lengths from 64 bytes to Jumbo frames (up to 16000 bytes)
- Traffic Generation –
- Supports multiple streams with varying test configurations
- Streams can be defined with various header fields like Source/Destination MAC Address, VLAN Id, Source/Destination Ipv4 Address, Source/Destination UDP ports
- EMIX frame sizes supported per service – up to 5 frame sizes can be defined per stream
- Stacked VLAN supported – C-Tag and S-Tag to simulate Carrier Ethernet traffic
- Traffic Analysis –
- KPIs supported - Information Rate (IR) or Throughput, Frame Loss Ratio (FLR), Frame Transfer Delay (FTD) or Latency, and Frame Delay Variation (FDV) or Jitter, measured simultaneously for multi streams
- Easily monitor the bandwidth performance using live throughput consolidated graphical view for all the streams
- Provides IR (throughput), FTD, FLR, FDV graphs
- Detailed per stream statistics for unique streams
- Provides per port frame statistics like Total Frames/Bytes Received, Rx Frame Rate, Rx Data Rate, etc
- Command Line Interface for automated testing and remote accessibility
Stream Configuration
Each Stream can be configured with various attributes like the Frame Size(s), Header Parameters (including VLAN Tag Information), IP and UDP layer parameters, Payload with fixed patterns, and Traffic rate.
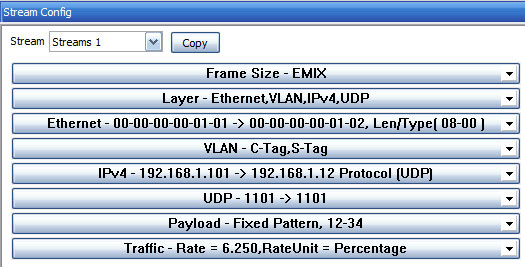
Stream Configuration Collapsed Summary
VLAN C-Tag Configuration
The VLAN C-Tag TCI frame format includes a 3-bit field used to Carry Priority Information (PCP), which refers to the Class of Service and maps to the frame priority level. The field values can be used to prioritize different classes of traffic (voice, video, data, etc).
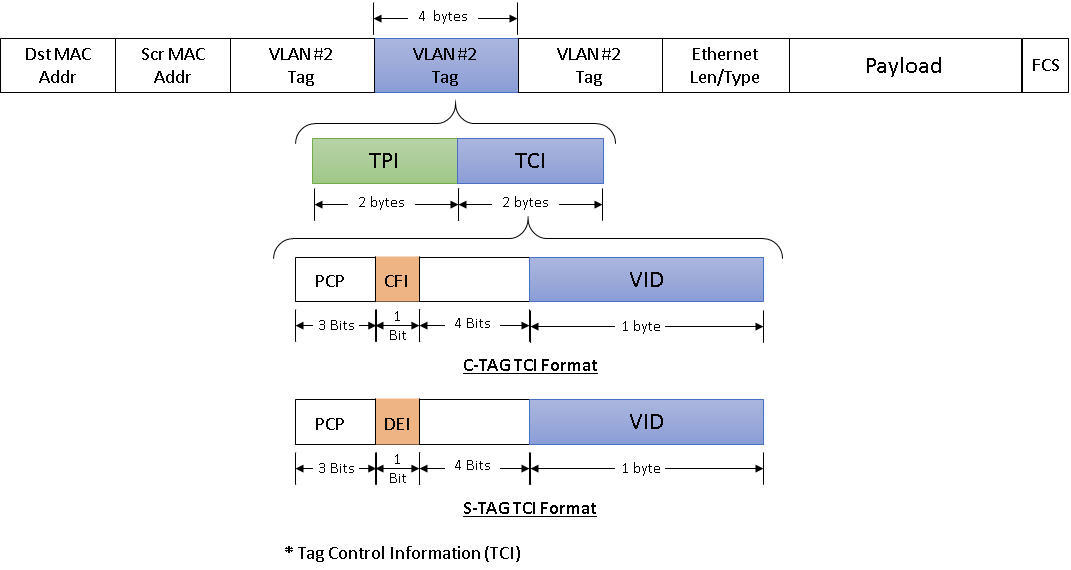
VLAN C-Tag TCI Frame Format
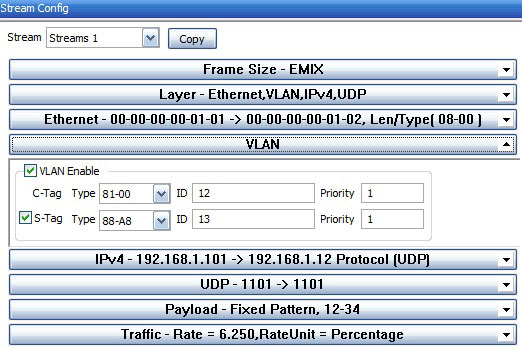
VLAN C-Tag
Payload Configurations
2 byte Hex payload for the test packet can be configured, which will be repeated for the entire frame payload.
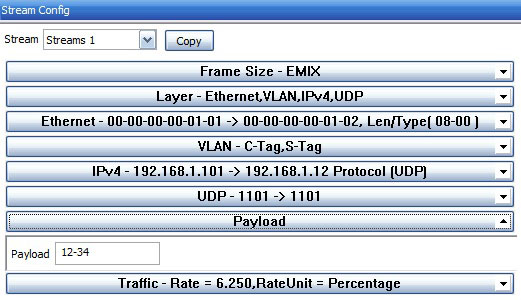
Payload
Traffic Configurations
This option allows to specify the rate at which frames have to be generated. Various units used for configuring the rate are % - Bandwidth in Percentage of the Link Speed, Kbps – Kilobits/Sec, Mbps – Megabits/Sec, Gbps – Gigabits/Sec, Bps – Bytes/Sec, KBps - Kilobytes/Sec, MBps – Megabytes/Sec, and GBps – Gigabytes/Sec.
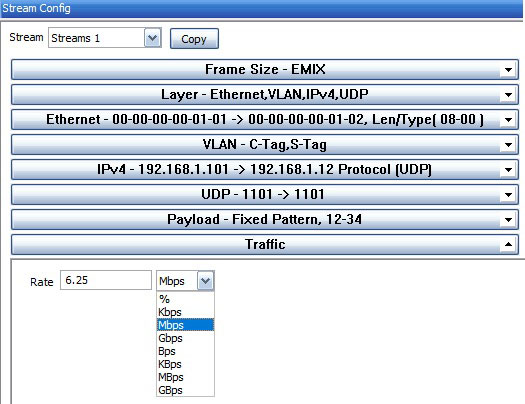
Traffic Option
Stream Selection
Stream selection provides an option to select any configured stream to run the test (or) select all the streams. Up to 12 streams are supported on 1G hardware unit and 16 streams are supported on 10G/1G ports on 10G hardware units. To select all the streams, each stream bandwidth should be configured such that the Total bandwidth is limited to ≤1000 Mbps (for 1G unit) / ≤10000 Mbps (for 10G unit). The configured Frame Size and the Rate (Mbps) for the stream is also displayed for each stream. The test is performed on all the selected streams simultaneously within the specified time duration.
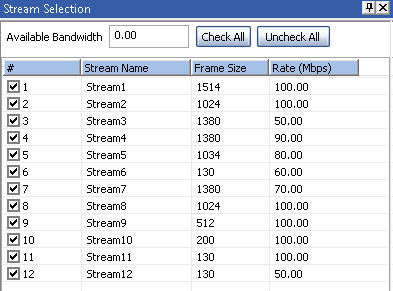 Stream Selection for 1G unit (12 Streams) |
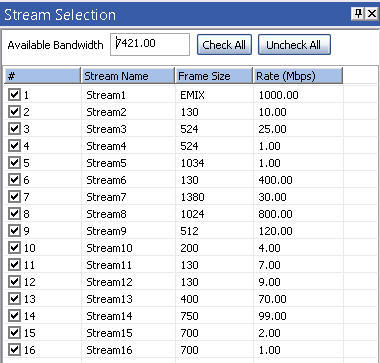 Stream Selection for 10G units (16 Streams) |
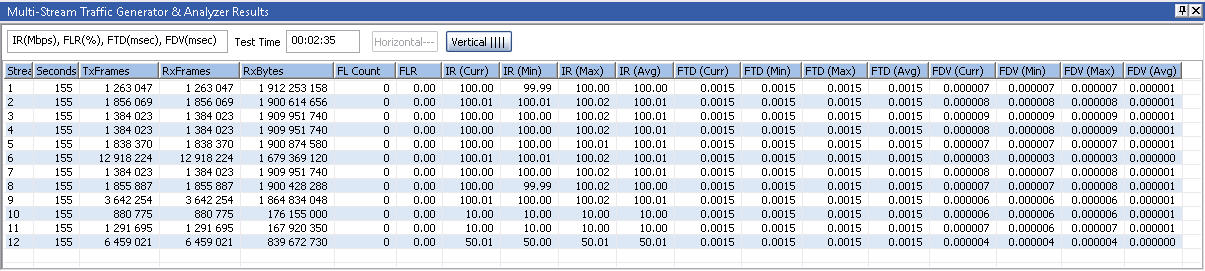
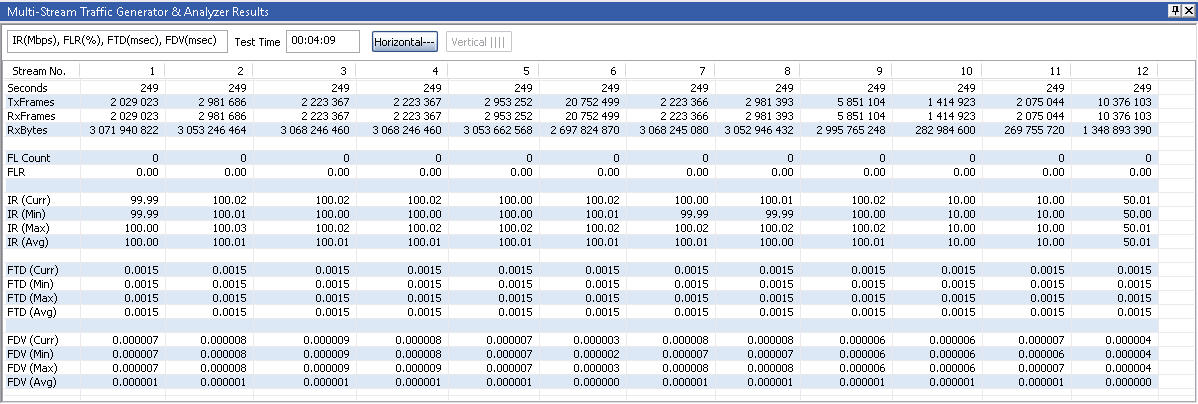
Stream Statistics
The Expert Analyzer displays the consolidated view of all the results across multiple streams (16 streams). The result parameters include Stream Name for which the test is running, test duration in secs, TxRx Frames, Rx Bytes, Frame Loss - FL Count, Frame Loss Ratio - FLR (%), (Current, Minimum, Maximum, & Average) Information Rate - IR (Mbps), (Current, Minimum, Maximum, & Average) Frame Transfer Delay - FTD (msec), and (Current, Minimum, Maximum, & Average) Frame Delay Variations - FDV (msec) parameters for each configured stream.
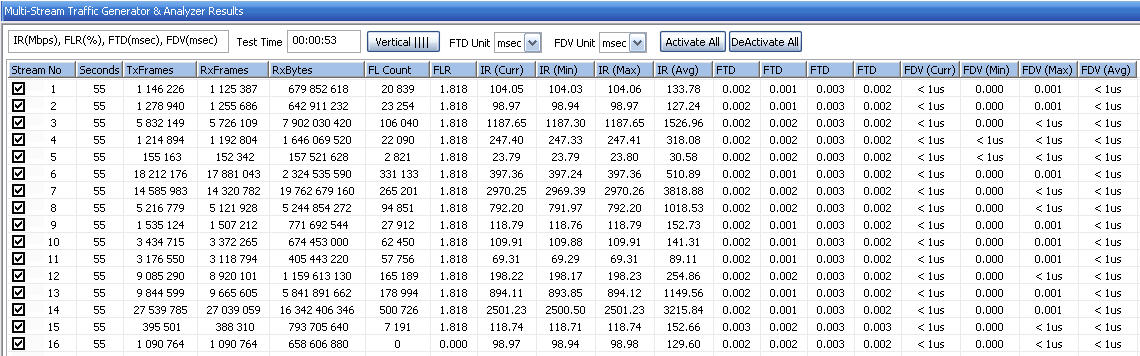 Vertical View of Stream Results |
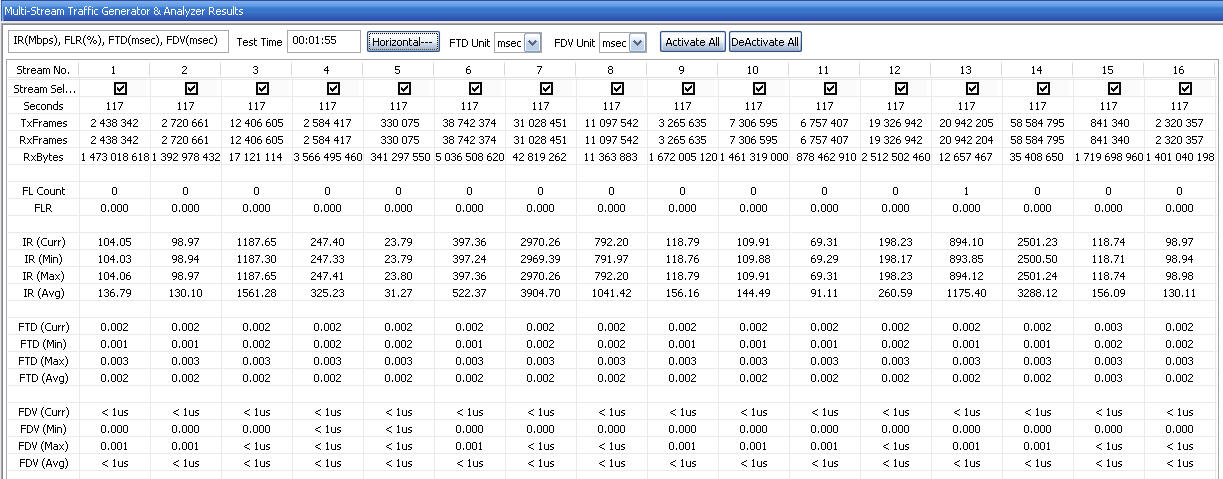 Horizontal View of Stream Results |
Stream-wise Graph
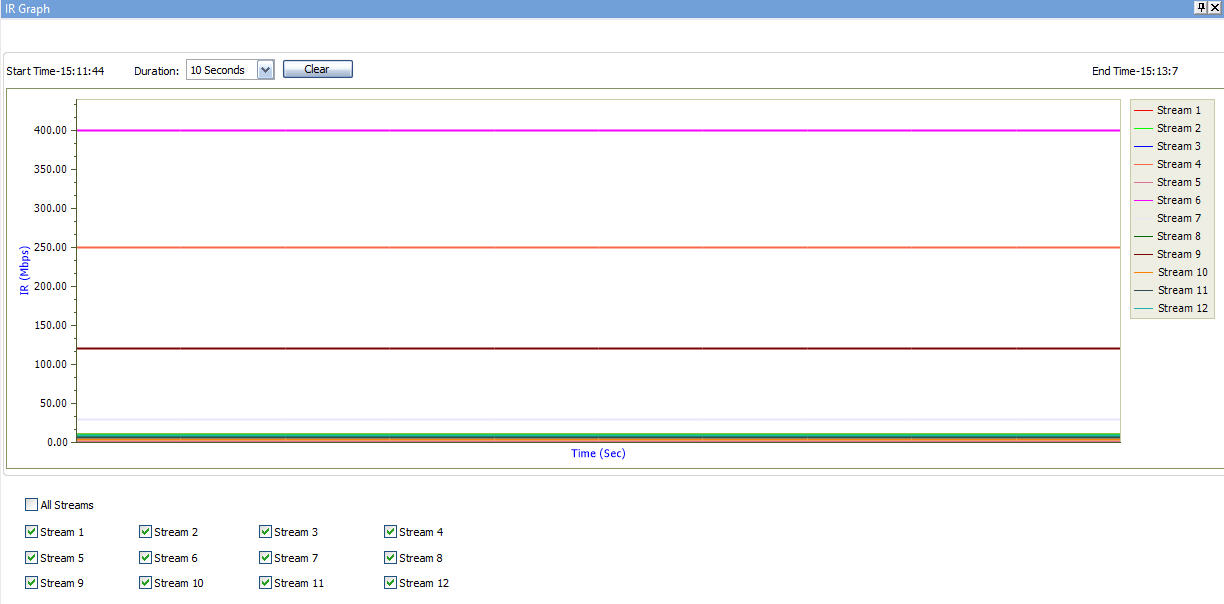
Throughput (IR) Graph 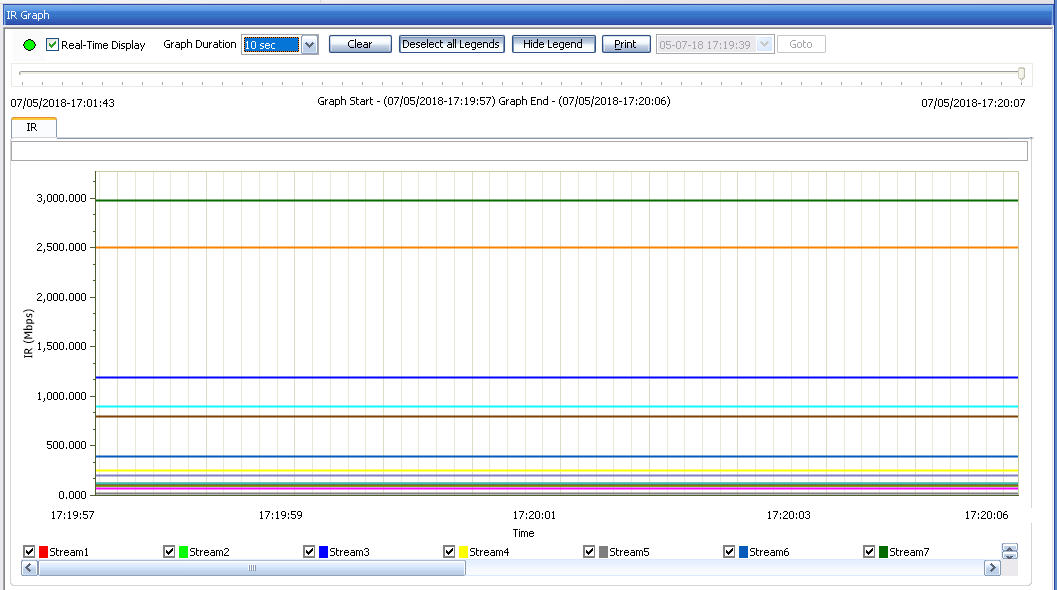
Stream Throughput (IR) Graph |
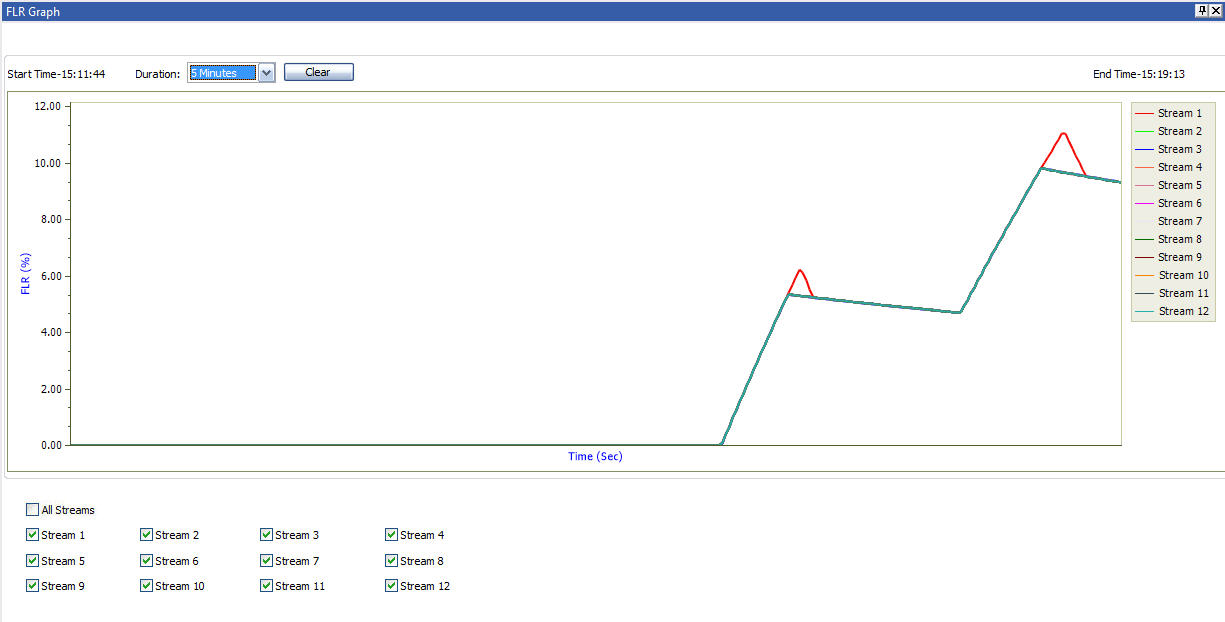
FLR Graph 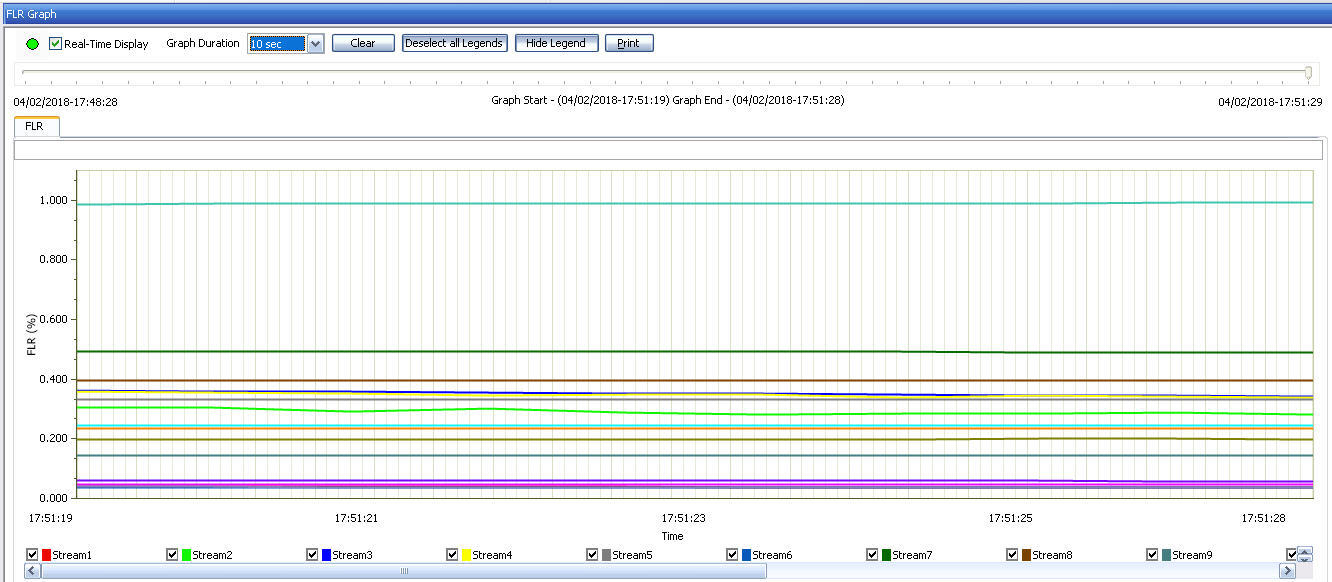
Frame Loss Ratio (FLR) Graph |
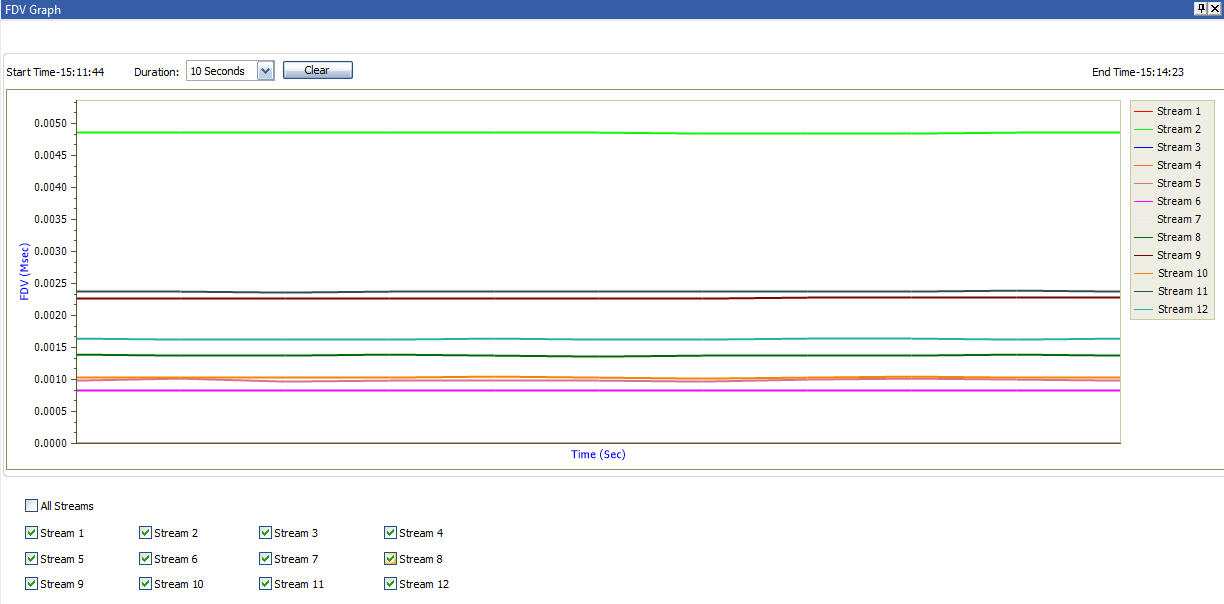
FDV Graph 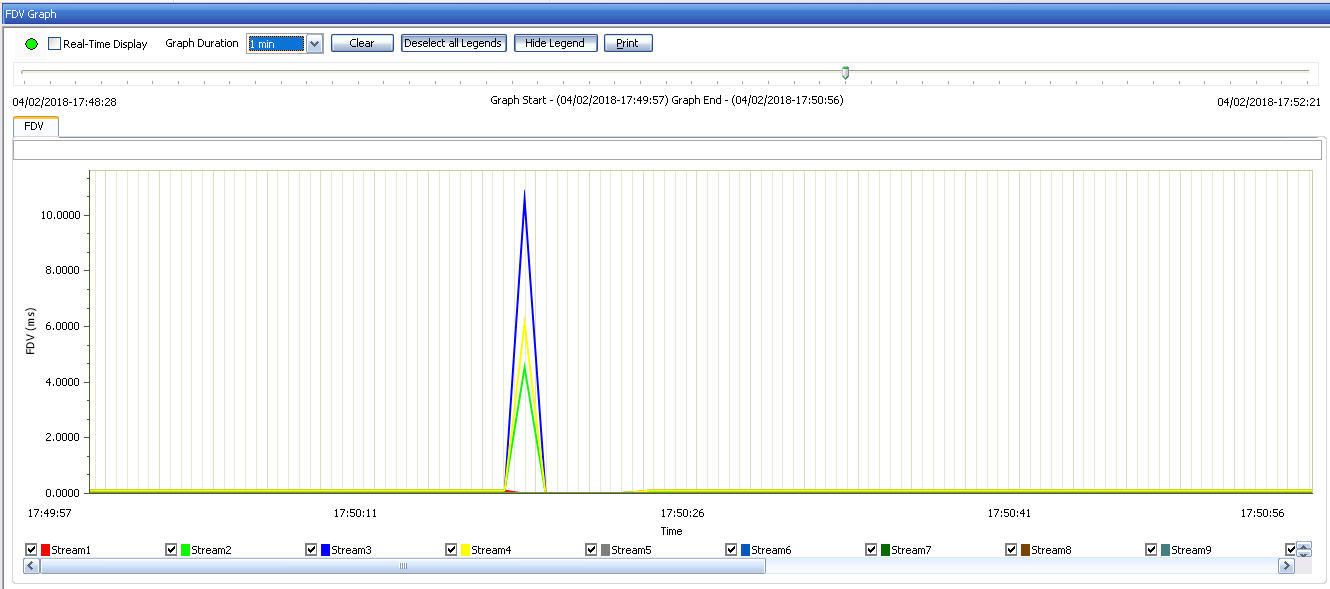
Frame Delay Variation (FDV) Graph |
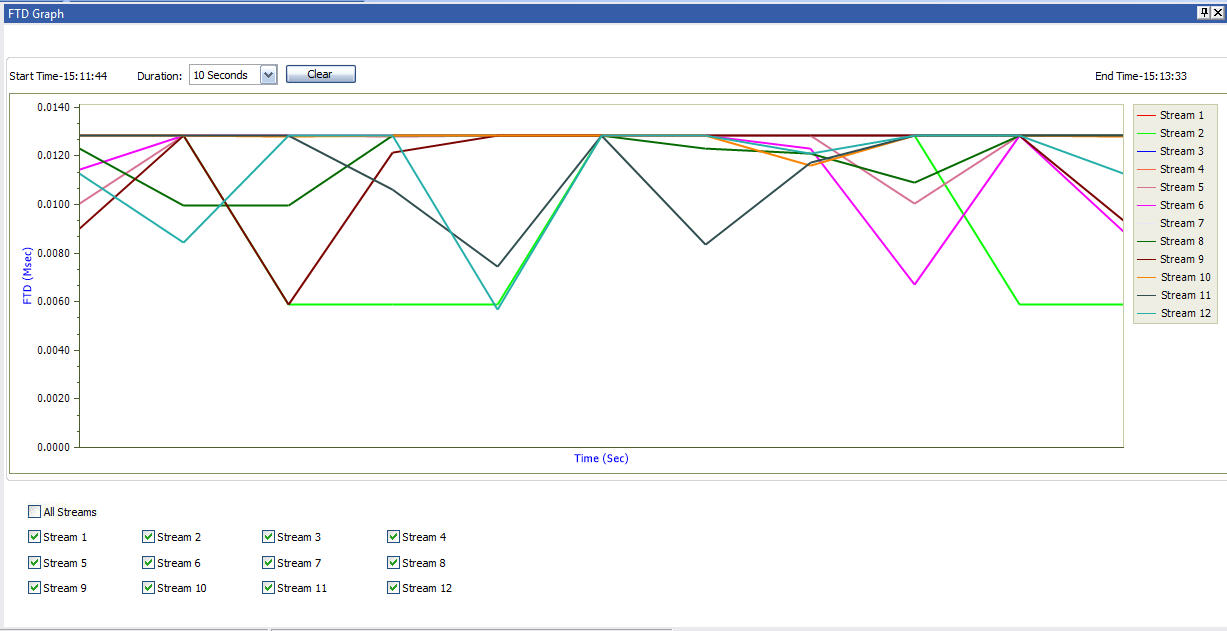
FTD Graph 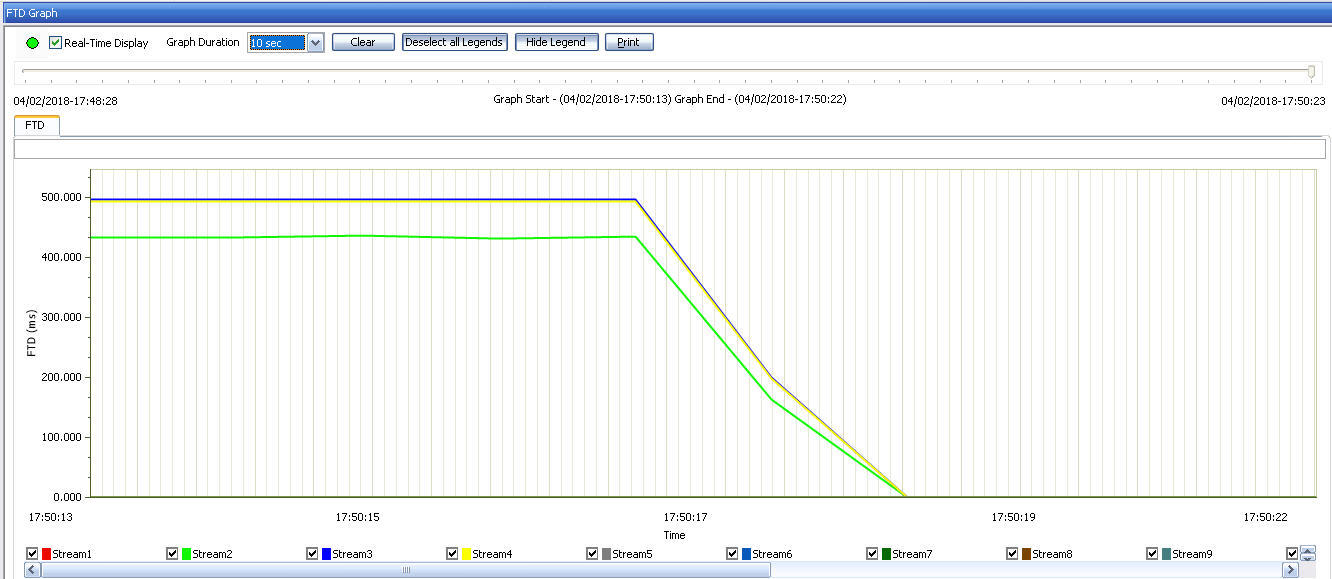
Frame Transfer Delay (FTD) Graph |
Stream Statistics
The Expert Analyzer displays the consolidated view of all the results across multiple streams (16 streams). The result parameters include Stream Name for which the test is running, test duration in secs, TxRx Frames, Rx Bytes, Frame Loss - FL Count, Frame Loss Ratio - FLR (%), (Current, Minimum, Maximum, & Average) Information Rate - IR (Mbps), (Current, Minimum, Maximum, & Average) Frame Transfer Delay - FTD (msec), and (Current, Minimum, Maximum, & Average) Frame Delay Variations - FDV (msec) parameters for each configured stream.
 Vertical View of Stream Results |
 Horizontal View of Stream Results |
Stream-wise Graphs
| Throughput (IR) Graph A real time display of Throughput for each stream is plotted as the Information Rate (Mbps) against Time (Sec), in the form of a line graph. Consolidated view of throughput graph for all the streams (16 streams on 10G ports) is displayed. The total throughput of all the 16 streams together will sum up to 1000 Mbps on 1G ports. |
FLR Graph A real time display of Throughput for each stream is plotted as the Frame Loss Ratio (%) against Time (Sec), in the form of a line graph. |
|
 |
| FDV Graph A real time display of Throughput for each stream is plotted as the Frame Delay Variation (Msec) against Time (Sec), in the form of a line graph. |
FTD Graph A real time display of Throughput for each stream is plotted as the Frame Transfer Delay (Msec) against Time (Sec), in the form of a line graph. |
|
 |
Traffic Generation over Satellite Networks
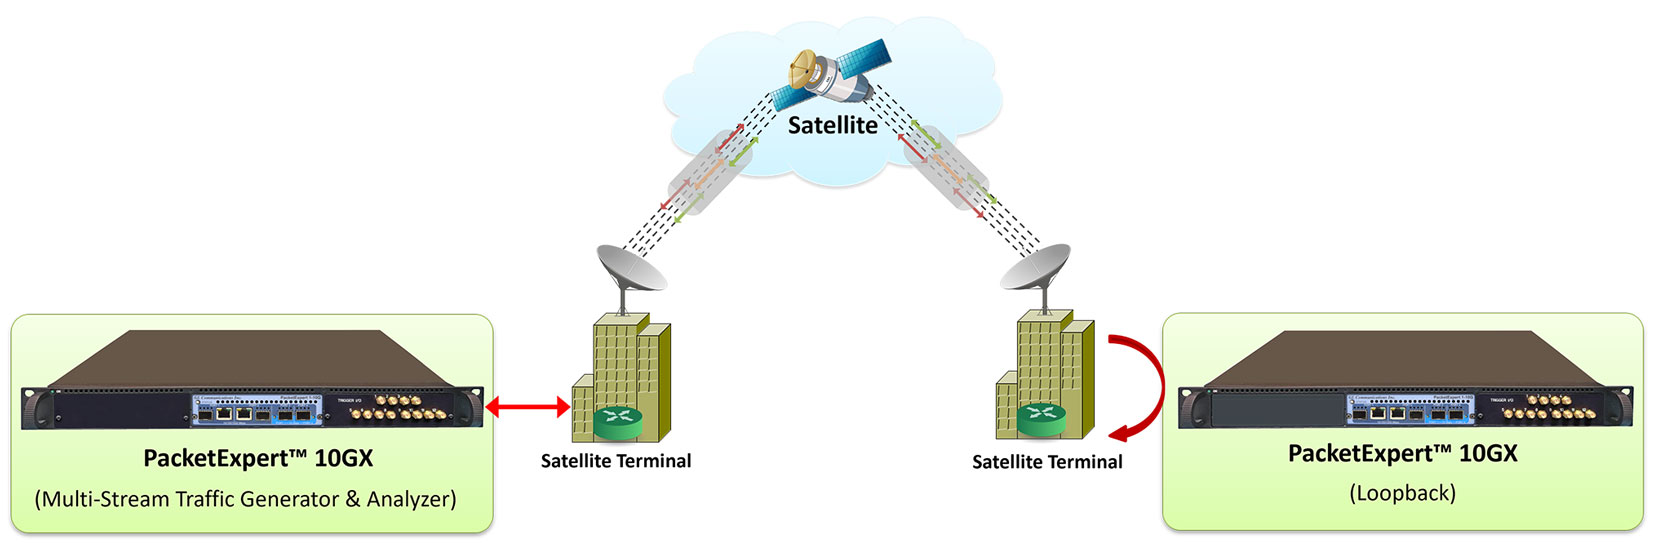
Users can generate traffic over satellite networks using PacketExpert™ 10GX and measure the subsequent throughput, round-trip delay, packet loss, jitter, and more. Using the Multi-Stream UDP/TCP Traffic Generator and Analyzer feature, the PacketExpert™ 10GX can create multiple streams of traffic, such as voice, video, and data, over satellite links.
For each stream, the device measures the throughput, delay, packet loss, jitter, and other fundamental packet metrics. Satellite networks often have prioritization schemes for different traffic streams based on Class of Service (COS) or Differentiated Services Code Point (DSCP) tags in the Ethernet frame or IP header. The PacketExpert™ 10GX can test these prioritization schemes by generating streams with different protocol headers, COS and DSCP tags. Users can view real time graphs of throughput, latency (with nanosecond precision), packet loss, etc. for each stream independently.
Network Testing with Impairments
The multi streams generated at port#1 is sent to the Loopback port (either the port#2 in the same hardware unit or the loopback port on another remote unit) through the network. The Loopback port sends the traffic back to the port#1 again through the network. This way, the multi-stream traffic traverses the network twice (in the upstream and downstream directions), and is subjected to network impairments like Latency, Packet Loss, Jitter, Packet reordering, Packet Duplication etc. in both directions. The received traffic on port#1 is analyzed and the IP metrics are reported.
At port#1, the received traffic is analyzed and Frame Loss Count, Frame Loss Ratio (%), Information Rate - IR (Mbps), Frame Transfer Delay (msec), and Frame Delay Variations (msec) results are displayed.
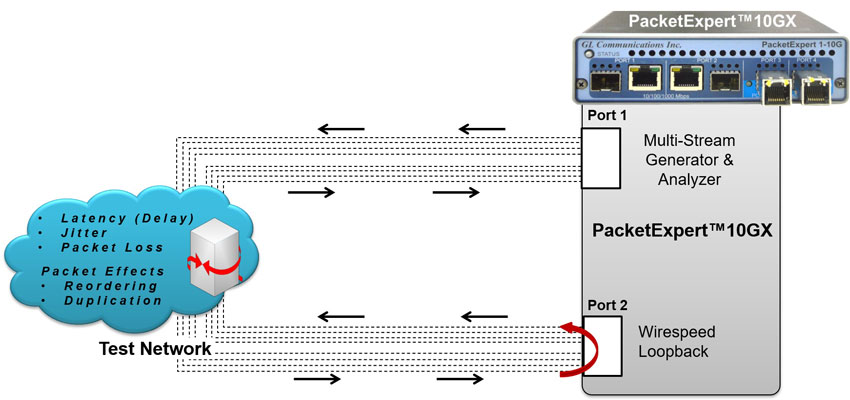
Multi-stream Traffic Generation and Analysis with Impairments
QoS Prioritization
Multi-stream traffic Generator and Analyzer can be configured to generate multiple background traffic streams, which stress the network and generate highly precise (hardware generated) single VoIP stream (foreground stream) to be sent along with the background streams. This test scenario can be used to verify the QoS prioritization in the network.
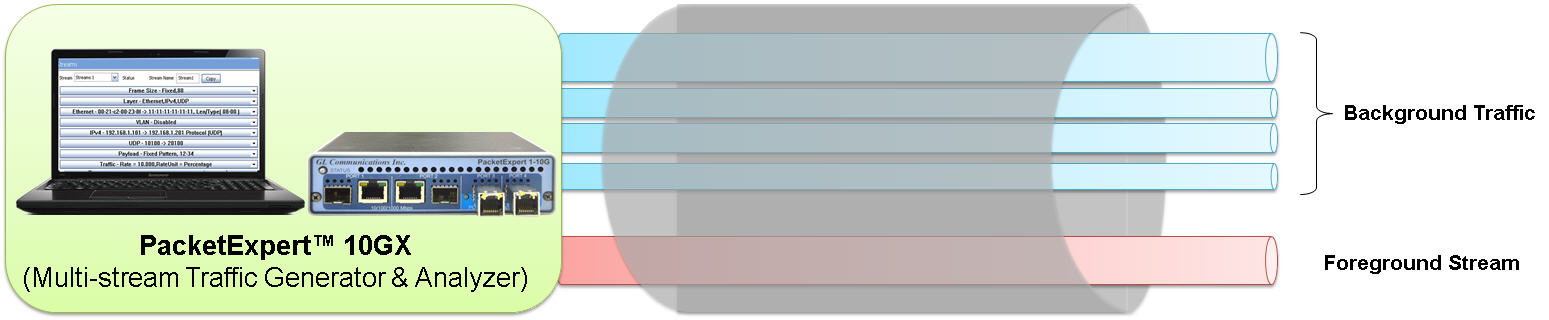
Background Traffic and Foreground Stream Generation
Stress Testing
Stress test DUT/Networks by generating up to 16 user defined streams at full wirespeed (1Gbps or 10 Gbps) using Multi-Stream Traffic Generator, pass the traffic through the test network towards the loopback port (remote port or local port), do wirespeed loopback to send back the traffic towards the generator port, do analysis of the received traffic at wirespeed, measure and report the IP metrics.
This will measure the Round trip metrics i.e. combined performance of both Upstream and Downstream directions.
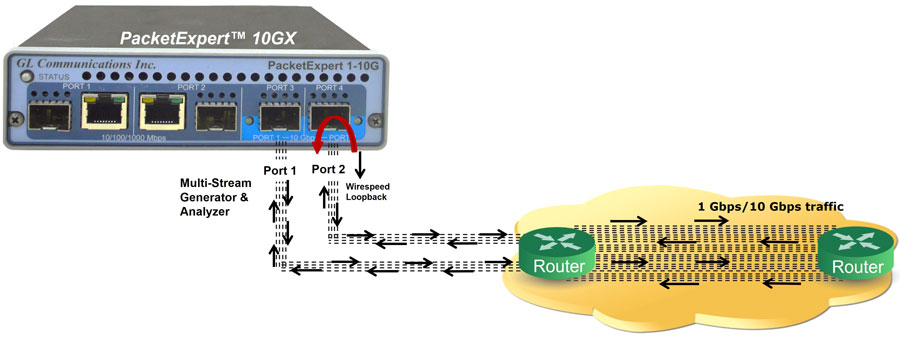
Stress (1 Gbps/10 Gbps Traffic) Testing
Resources
Note: PCs which include GL hardware/software require Intel or AMD processors for compliance.
| Item | Description |
|---|---|
| PXN100 | PacketExpert™ 10GX |
| PXE100 | PacketExpert™ 1G |
| PXN108 | Multi-Stream UDP/TCP Traffic Generator and Analyzer – for PXN100 |
| PXE108 | Multi-Stream UDP/TCP Traffic Generator and Analyzer - for PXE100 |
| CXN100 | CLI Server for PXN100 |
| CXE100 | CLI Server for PXE100 |
| PacketExpert™ 10GX - Brochures |
|---|
| PacketExpert™ 10GX |
| PacketExpert™ 10GX - MTGA |
| PacketExpert™ 10GX mTOP™ |
| PacketExpert™ 10GX CLI |
| PacketExpert™ 1G - Brochures |
| PacketExpert™ 1G |
| PacketExpert™ 1G - MTGA |
| PacketExpert™ 1G - mTOP™ |
| PacketExpert™ 10GX - Presentations |
| PacketExpert™ 10GX |
| PacketExpert™ 10GX - MTGA |
| PacketExpert™ 1G - Presentations |
| PacketExpert™ 1G |
| PacketExpert™ 1G - MTGA |
| PacketExpert™ 10GX - Sample Reports - PDF |
| PacketExpert™ 10GX - MTGA Report |
Webinar
Comprehensive Ethernet Testing Solutions