GL Communications Introduces Advanced IP Analytics™ Tool
Gaithersburg, Maryland, USA - April 16, 2024 - GL Communications Inc., a global leader in telecom test and measurement solutions, addressed the press regarding their new “IP Analytics™” Tool application designed for analyzing data in IP (Internet Protocol) networks. This tool is essential for monitoring and maintaining Quality of Service (QoS) in telecom networks by examining IP-based data streams at high speeds.

Vijay Kulkarni, CEO of GL Communications, states, “IP Analytics™ is a powerful addition to GL’s suite of network analysis tools. This tool provides detailed insight into recorded IP traffic captured at high speed. By analyzing IP traffic and data, telecom companies can enhance network performance, troubleshoot malfunctioning infrastructure, improve customer satisfaction and increase operational efficiency.”
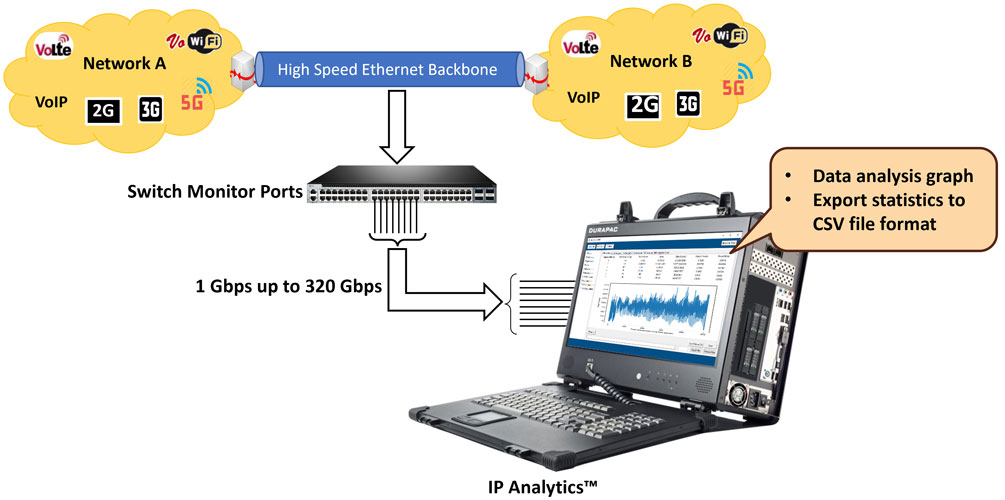
At the core of IP Analytics™ lies its capability to capture all Ethernet packets and organize them into flows based on crucial parameters, including IP Class of Service, IP Addresses (both Source and Destination), and UDP/TCP Port Numbers (both source and destination). This is done at data rates up to 320 Gbps.
IP Analytics™ empowers users with precise categorization of packets and flows. By categorizing flows based on IP Class of Service, users can grasp the impact of different service classes on network performance. Furthermore, analyzing flows based on unique IP addresses enables users to assess the traffic volume at individual nodes, shedding light on network load and potential bottlenecks. The tool examines traffic between pairs of IP nodes, enriching understanding of network interactions. Additionally, users can identify application-specific traffic patterns based on TCP/UDP port numbers, crucial for effective application performance monitoring.
IP Analytics™ stands out due to its capability to compute and visualize crucial network metrics with millisecond precision. It allows users to measure the volume of data within each categorized flow through Packet Count and Byte Count, while dynamically calculating and plotting Packets/sec and Bits/sec rates, offering real-time insights into network throughput. These metrics are not just calculated for each flow but also for each Ethernet port, offering a comprehensive overview of network performance.
Leveraging the export capabilities from IP Analyzer, which is then converted into HDF5 format, IP Analytics™ allows users to perform extensive data analytics operations using VAEX (Python Library). This integration ensures that users can easily handle large datasets, applying various analytics operations with efficiency and speed.
Additionally, IP Analytics™ introduces a customized filtering mechanism. This feature allows users to conduct detailed analysis on specific portions of the traffic, while filtering out extraneous traffic.
Using PacketScan™ HD system along with FastRecorder™ application, users can capture the traffic and analyze the captured data using GL IP Analytics™ tool. This device comes in rack-mountable and portable form factors and supports data rates from 1 Gbps to 100 Gbps on an individual port. Furthermore, PacketScan HD supports up to eight ports in a single appliance. Therefore, it is an all-in-one solution for both high speed capture and real-time analysis.
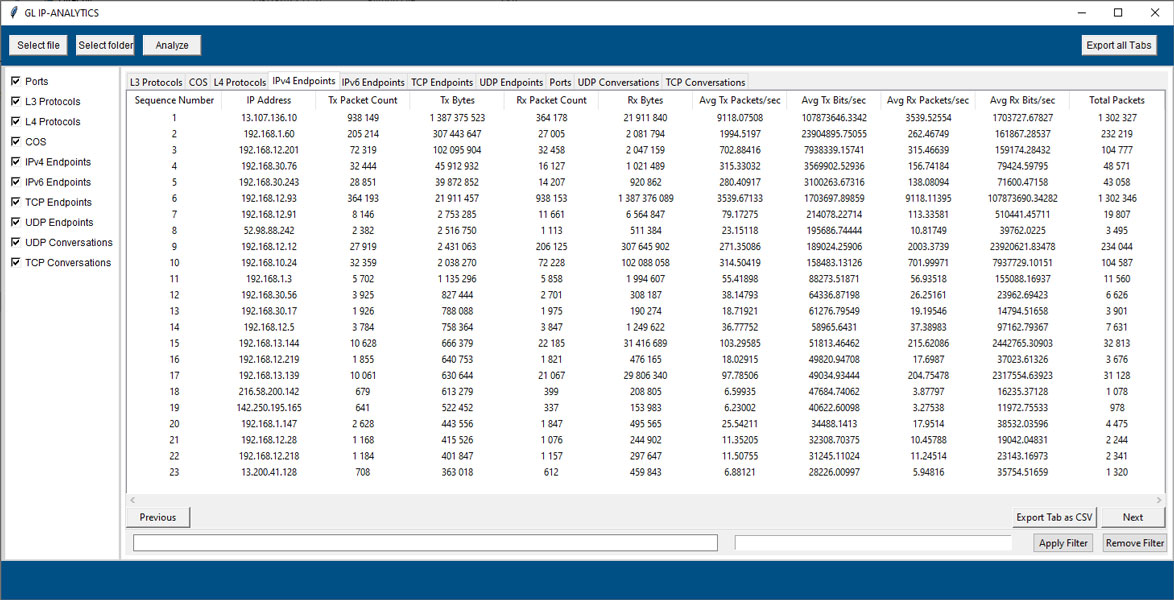
GL's IP Analytics™ tool is designed to analyze HDF5 files, extracting comprehensive statistics. From Layer 3 Protocols to Class of Service (Differentials Services Codepoint), Layer 4 Protocols, and beyond, it provides insights into IPv4 Endpoints, IPv6 Endpoints, UDP Endpoints, TCP Endpoints, UDP Conversation, TCP Conversation, and Port wise details.

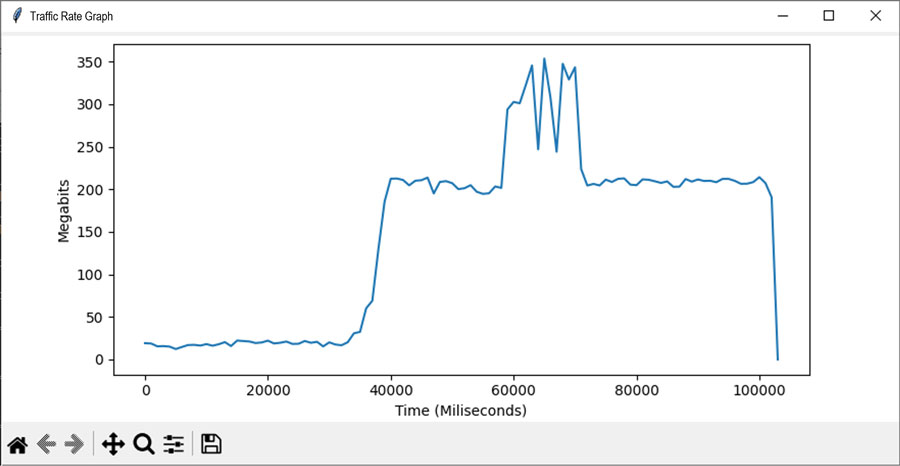
With PacketExtractor™, an optional add-on to PacketScan™ HD, users can conduct throughput analysis. The integration of GL's Traffic Rate Graph Plotter tool enhances functionality, allowing for a comprehensive analysis of network traffic. Utilizing HDF5 files, GL's Traffic Rate Graph generates detailed graphs for individual recorded ports.
The link below shows a throughput graph with millisecond precision. At first a constant throughput of 20 Mbps is observed. However, at the 40th second, there is a sudden increase to 200 Mbps. Additionally, there are spikes in the throughput between 60 and 75 seconds. These throughput graphs help network providers troubleshoot bandwidth consumption of applications and infrastructure.

Key Features
- Comprehensive Coverage: Includes detailed analysis of Layer 3 Protocols, Class of Services (DSCP), Layer 4 Protocols, IPv4 Endpoints, IPv6 Endpoints, TCP Endpoints, UDP Endpoints, Recorded Port statistics, UDP Conversations and TCP Conversations along with Port wise details
- Input Output Graph Support: Provides in-depth graph analysis for both Bits/sec and Packets/sec
- Advanced Filtering: Provides advanced filters to analyze the packets of interest
- Export Functionality: Export desired information to CSV file format for further analysis
- Flexible File Selection: Allows selection of either a single Data Analysis HDF5 file or multiple HDF5 files from the folder
- Column Sorting Options: Provides the flexibility to sort columns in Ascending or Descending order for easier data interpretation
- Traffic Rate Graphs: Plots throughput for various time intervals
 Back to Press Releases Index Page