Distributed Monitoring System at Probe Level
(TDM / Wireless/ IP Networks)
18th Oct 2018
Welcome to another October 2018 issue of GL Communications newsletter providing information and insight into our Distributed Monitoring System at Probe Level. This newsletter gives an insight into our NetSurveyorWeb™ Lite, an addon tool for the operators looking for cost-effective and simple plug-and-play solution, a simplified web-based network surveillance system.
The NetSurveyorWeb™ Lite version is enhanced to work with GL’s Voice Band Analyzer and Delay Measurement tools to analyze captured voice traffic and provide precise voice and one-way delay metrics.

In today's advanced telecom networks, surveillance of network characteristics is becoming more important than ever before. Performance Monitoring, Remote Protocol Analysis, Voice Quality Analysis, Delay Measurements, Capacity Management, Troubleshooting, Security, Fraud Detection, Alarm Monitoring, Billing Verification, Failure Prediction and Traffic Engineering are some aspects that necessitate continuous monitoring of network health.
Any network operator, service provider, or equipment manufacturer must have the means to perform capture and surveillance tasks remotely, automatically, and non-intrusively. Fortunately, the network backbone contains a wealth of information that can be monitored and collected to support these activities.
GL Communications tailored test equipment and software solutions meet the critical aspects of network surveillance for real-time deployment readiness, 24/7 availability, non-intrusive monitoring, alerting, and reporting.
GL’s new easy-to-deploy NetSurveyorWeb™ Lite application and accompanying probes helps customers get in-depth analysis of each and every call on their network for troubleshooting. NetSurveyorWeb™ Lite is a web-based application that facilitates display of Call Detail Records (CDRs), filter-out the calls of interest, play voice files, analyze voice traffic, perform critical voice/fax/delay measurements, consolidate different reports, build custom KPIs and alerts that are of critical importance to customers.
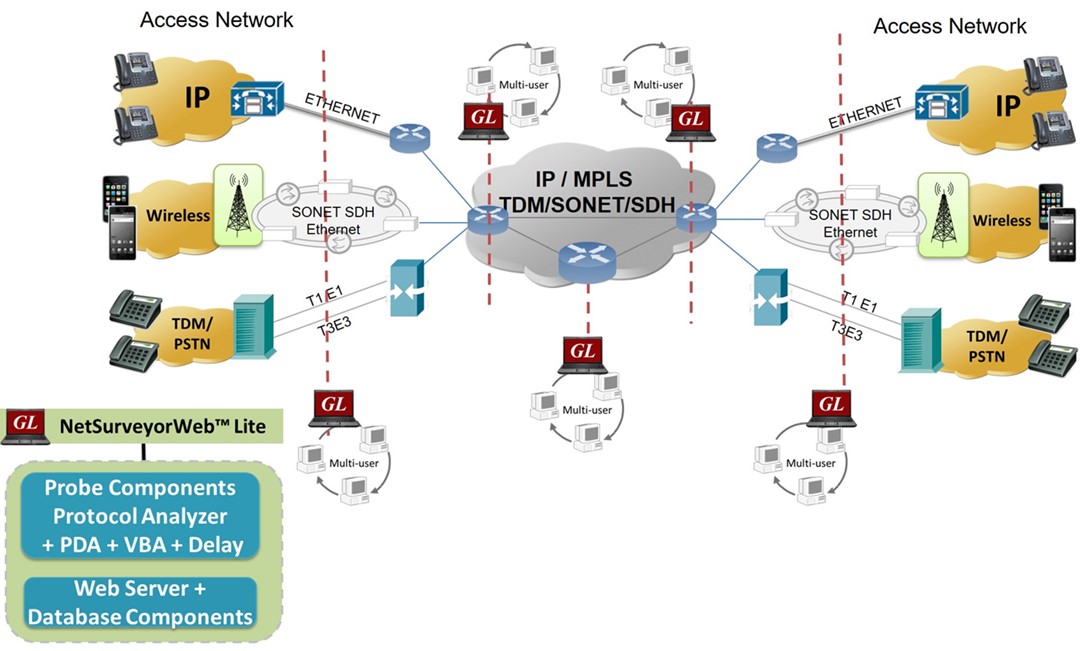
NetSurveyorWebLite™ is an integrated and a cost-effective monitoring system, that allows multiple protocol analysis probes, and all central system components such as database engine, and web server to run on a single system. The architecture is uniform across all types of networks, TDM, IP, and Wireless. This results in a reliable user-friendly and uniform approach to Reports, Administration, and Maintenance. The system allows for easy plug-and-play and simplified deployment process to start monitoring the networks.
Essential Components of Monitoring System
The NetSurveyorWeb™ Lite system comprises of three tier distributed architecture driven by non-intrusive hardware probes, webserver, intelligent software, and a database engine. All components of the system reside at the PROBE-PC. The architecture allows the user to simply deploy it at multiple locations in the network and perform critical measurements.

The NetSurveyorWeb™ Lite system works with following capture and analysis components in the backend to give a complete solution –
- TDM, Optical, or IP Protocol Analyzer + PDA probes
NetSurveyorWeb™ Lite application connects to TDM, Optical, or IP Protocol Analyzer probes through a web server for monitoring physical layer, signaling and traffic. NetSurveyorWebLite™ at the Probe Level PCs acts as a simple addon tool with real-time protocol analyzers to monitor CDRs and record voice files. The protocol analyzers with enhanced PDA features captures and monitors live signaling and record traffic over TDM/IP/Wireless networks. The application can capture, segregate, monitor and collect statistics all types of calls over network. The call data records and call flow of the selected protocol are automatically exported in CSV format and are stored into a relational database (Oracle). The interface between the probes and the database is well defined and is called "Loader" to stream data. With the use of NetSurveyorWeb™ Lite application, the real-time and historic call data records can be accessed using simple web browser interface for remote / local monitoring.
- Voice Band Analyzer
NetSurveyorWeb™ Lite NetSurveyorWeb™ Lite application works with Voice Band Analyzer (VBA) application to analyze captured voice/fax traffic and provide useful metrics that are of interest to service providers. Important measurements provided by this application are listed below -
- Speech Metrics measured in accordance with ITU-T P.56 Method B
- Active Speech Level (ASL in dBm)
- noise level (NL in dBm)
- speech activity factor (AF in %)
- power measurements (RMS, dRMS in dBm, DC Level in %FS)
- clipped samples
- DC level
- detail voice band events occurrence during the call including reporting of traffic as tones (ring, busy), digits (DTMF, MF, MFC-R2), fax tones, modem signals, and more
- Hybrid Echo analysis module for Line Echo measurement. It outputs
- Echo Return Loss - ERL (dB)
- Echo Delay (ms)
- Echo Dispersion (ms)
- Traffic Classifier to detect, classify, and display the amount of traffic - whether its Fax, Voice, Digits , Tones, or Silence present in the network
- FaxScan™ used to analyze voice band traffic files for Fax traffic on 2-wire or 4-wire captures. It outputs fax signaling frames in a log file and Fax image in TIF format
- Tone Decoder can detect and decode the following different types of phone tones -
- DTMF, MF
- Caller ID, Caller ID - Call Waiting
- Paging Tones
- Teletype (TTY)
- Frequency-Shift Keying (FSK)
- Specific Area Message encoding (SAME)
- Visual Message Waiting Indication (VMWI)
- Special Information Tone (SIT)
- Silence, ring-back, busy tones or any Custom Tones from the PCM wave file / wave streams
The Speech Level module with VBA analyzes the captured voice files and measures important speech metrics according to ITU P.56 standard. These measurements help detect call anomalies and detect impairments in voice channels in near real-time and thereby quickly remove or rectify the impairing channel from the live network.
The Traffic Classifier module with VBA analyzes the captured files and categorizes the call as voice, fax, and modem data. It outputs the amount of Fax, Voice, Digits, Tones, Silent and Idle traffic present in the network and generates the following statistics:
The Fax Traffic module with VBA process WinPCAP, 2-Wire and 4-Wire voice band capture files to analyze the T.38 packets, T.30 frames. It provides detail decode of a Fax call with TIFF image, and call-flow indicators for complete analysis of fax call.
The 2-Wire Line Echo Analysis module with VBA can measure hybrid line echo generated using the captured files at both end points, and generate Echo Return Loss (ERL), Echo Delay, and Echo Dispersion measurement values.
The Tone Decoder module with VBA module is a highly efficient FFT module, which can monitor the signal arriving at the receive end, and decodes the tone type as DTMF, MF, Frequency-Shift Keying (FSK), Teletype (TTY), Special Information Tone (SIT), Specific Area Message Encoding (SAME), Voice Mail Waiting Indication (VMWI), Paging Tones, or any Custom Tones from the captured PCM wave file or wave stream. The module also detects and decodes the Type 1 Caller ID, Type 2 Caller ID - Call Waiting (CID-CW), silence, ring-back, busy or other phone tones.
The below screen shot gives the Voiceband Statistics for each direction of the call:

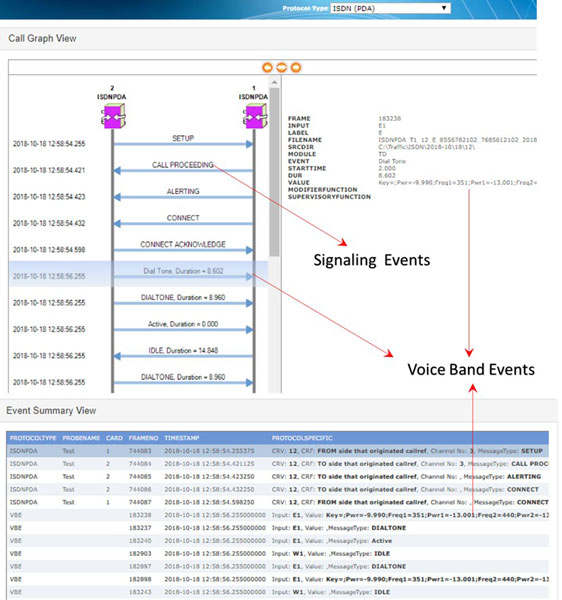
The below screen shot gives the Voiceband Event Summary along with detailed message sequence flow:

The below screen shot depicts the Voice traffic KPIs derived from VBA statistics.

- Delay Measurement
NetSurveyorWeb™ Lite also works with Delay Measurement tools to analyze captured voice traffic and provide precise one-way delay metrics. For a given call which traverse through Gateway, traffic is sampled at both TDM and IP analyzer at the same point of time running in the same server. These captured segments of SIP and ISDN calls will be saved in *.pcm formats. These samples will be given to delay measurement module which compares the samples based on the timestamp and provides the delay metrics.
The NetSurveyorWeb™ Lite application along with Delay Measurement application helps to monitor the delays such as Minimum Delay, Maximum Delay, and Average Delay for each call.

All metrics from different capture and analysis tools are consolidated into central database and presented in web-browser to drill down to calls-of-interest. As depicted in the screenshots below, one can view real-time and historic data including call ID, probe name/location, call disposition, calling and called number, and call duration.

Advantages of NetSurveyorWebLite™:
- Flexible report generation
- Ability to identify and analyze CDR using Key Performance Indicators (KPI’s)
- Ability to listen to the Voice calls
- Set alarm conditions and generate alerts of different types like email alert, visual alert, audible alert, or even log into tables for future analysis
- Reports are displayed both in tabular and graphical formats; customize reports and graphs based on SQL queries
- Graphs provided for Call Completion Ratio, Answer Call, Listening MOS, Conversational MOS, Failure Cause, and Call Duration
- Real-time data displays information such as called number, calling number, source & destination IP address, RTP packet details, call flow graph, frame decodes and more
- Apply single or multiple filters for data analysis; use logical operators between filters
- Historical data retention up to 9 GB
- Ability to export both graphical and tabular reports view as PDF
- Ability to export the call detail records displayed based on time filter or record index as PDF and CSV.
Filters and Key Performance Indicators
Protocol Selection (TDM, VoIP, Wireless)

Filtering for Calls-of-Interest
The below graph shows how GL’s NetSurveyorWeb™ filters ISDN records based on Called/Calling Number (Number of Interest)

The below graph illustrates how GL’s NetSurveyorWeb™ filters SMS records on GSM network based on Local Languages or English (Words of interest)

NetSurveyorWeb™ - Filtered TDM ISDN Call Records
Building Custom KPIs
The below graph shows KPIs of the UMTS calls such as Total Calls, Passed Calls, Alerted Calls, and Failed Calls.

Simultaneous Calls on All Trunks
This graph shows the call volume trends throughout the day. Users can examine the number of simultaneous calls that occurred at a certain time of day.

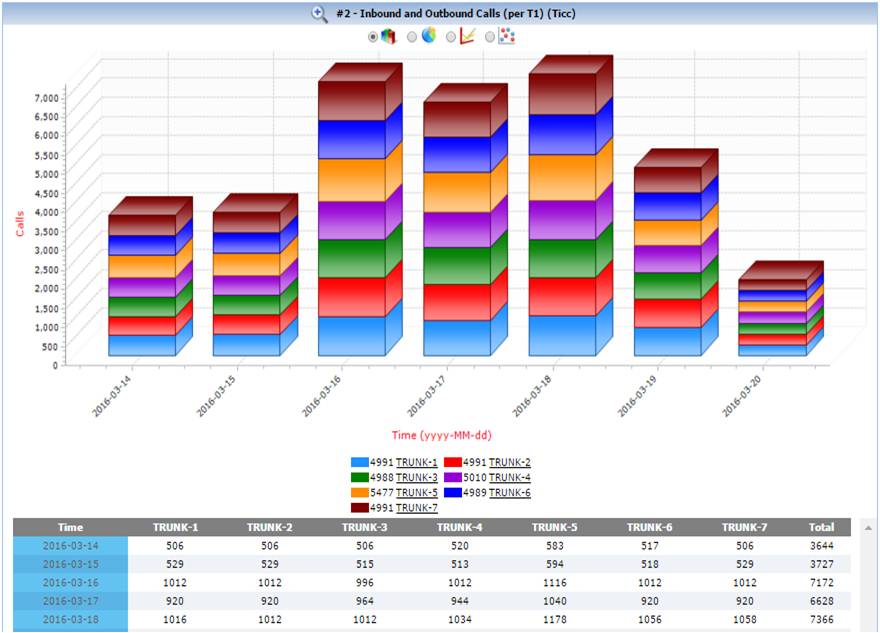
The below graph shows the Inbound vs Outbound Calls over T1 ISDN Trunk KPIs.

NetSurveyorWeb™ KPIs
The below graph depicts KPIs delay measurements.

This KPI below allows the user to quickly identify the different call completion types on the network. Call completion types in ISDN include: Normal Call Clearing, User Busy, Call Rejected, etc

NetSurveyorWeb™ - Call Types
 Back to Newsletter Index Page