Duplex 400G Wirespeed Packet Capture and Extraction Solution for High-Speed Networks
High-speed packet capture and extraction for network analysis and diagnostics. Ensures wirespeed recording without packet loss. Supports Ethernet rates of up to 400 Gbps.
Request a Demo / Quote Brochure
FastRecorder™ and PacketExtractor™ 400G Portable Unit
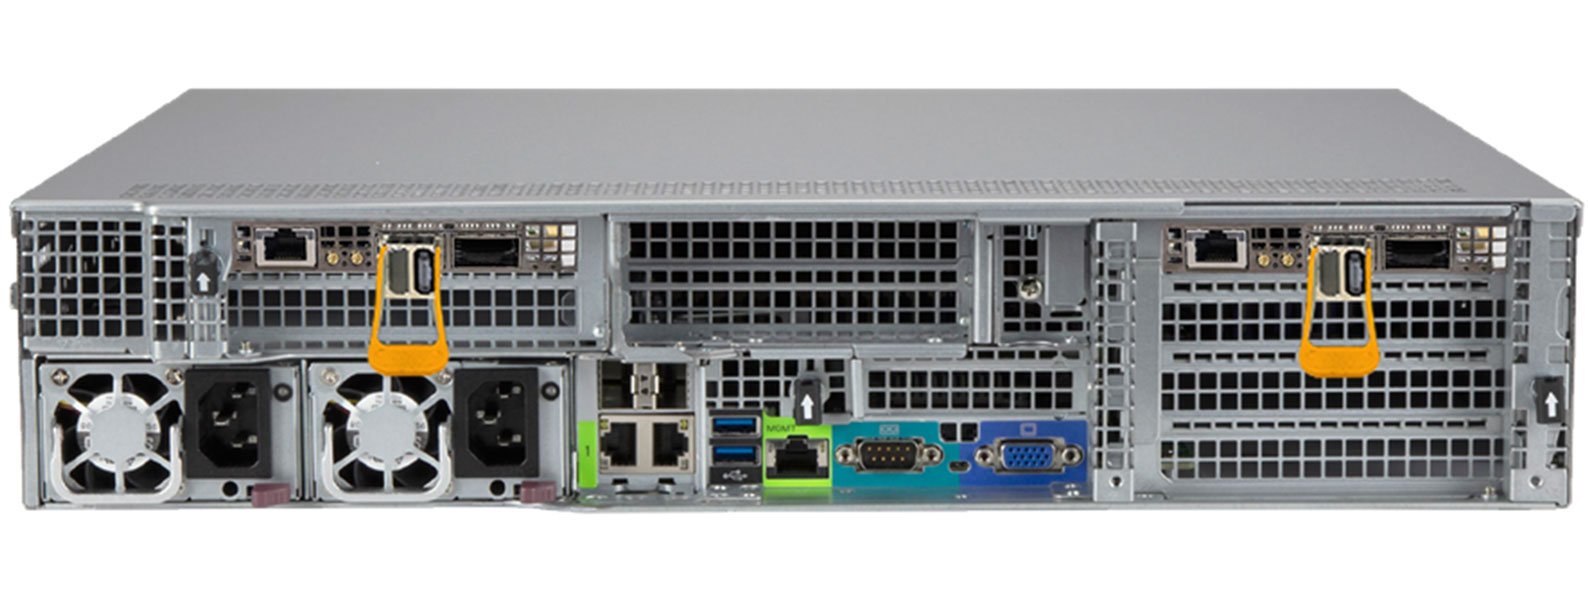
FastRecorder™ and PacketExtractor™ 400G 2U Rack-mount
Overview
GL's Linux-based FastRecorder™ and PacketExtractor™ 400G/800G appliance offers high-performance monitoring, analysis, capture, and real-time capture capabilities, supporting two ports at speeds of up to 400 Gbps each (2 x 400 Gbps) with scalable support for 800G total throughput. Designed for inline packet capture to hard disk or SSD, it ensures seamless, error-free, and continuous wirespeed data recording for extended durations, with storage to high-capacity NVMe SSDs (up to 240 TB). A circular buffer mechanism enables uninterrupted operation, ensuring the most recent 240 TB of data is always available. The appliance includes a secure, web-based interface for remote and multi-user access, with test automation and regression testing enabled via Python and REST APIs.
The FastRecorder™ operates in real time and connects non-intrusively via a fiber tap at bidirectional Ethernet rates up to 800 Gbps. With FPGA-based SmartNICs for 400G packet capture and analysis, it allows rapid configuration and filtering, enabling targeted recording of specific packets or sessions — ensuring accurate capture at wirespeed. Data is written directly to NVMe storage for extended-duration recording. The system also provides detailed capture metrics, including duration, data rates, frame statistics, dropped packets, and total recorded bytes, along with port-level statistics like link status, bandwidth usage, error counters, and frame length distribution. This makes packet capture easy and simple, even in complex, high-speed environments.
The PacketExtractor™ works offline, allowing users to process raw recordings by applying filters, selecting streams, defining time ranges, and extracting specific packet segments (e.g., headers) for in-depth analysis. Extracted data (up to 240 TB) can be saved in PCAP or PCAPNG formats for further diagnostics.
Files captured using FastRecorder™ and PacketExtractor™ 400G/800G can be analyzed using GL’s PacketScan™ HD or Wireshark®. While Wireshark® remains a widely-used tool, PacketScan™ HD provides enhanced functionality including real-time voice and fax quality monitoring, call/session separation, and visual ladder diagrams - ideal for deep network diagnostics and performance analysis in modern 400G/800G networks.
Why packet capture?
- Real-Time Packet Monitoring and Analysis
- Post-Capture Analysis and Extraction
- Targeted Capture with Filtering
- Efficient Storage and Retrieval
Purpose-Built for 400G Network Demands
GL’s 400G packet capture and extraction tools are purpose-built to do one thing extremely well: deliver reliable, lossless, high-speed packet capture at full line rate. Designed with a performance-first mindset, our solution is optimized specifically for high-throughput environments, ensuring accuracy, efficiency, and scalability tailored to your most demanding network applications.
Precision Timestamping for 400G Networks
Achieve nanosecond-level accuracy with our advanced timestamping capabilities—perfectly aligned for 400G environments.
We offer high-precision timestamps using Pulse Per Second (PPS), delivering globally synchronized time accuracy down to ±10 nanoseconds.
Key Features
FastRecorder™ 400G
- High-Speed Duplex 400G Capture (Up to 800 Gbps Total Throughput): Duplex 400G capture (400G East + 400G West) delivering up to 800 Gbps directly to SSDs — records up to 6 TB per minute
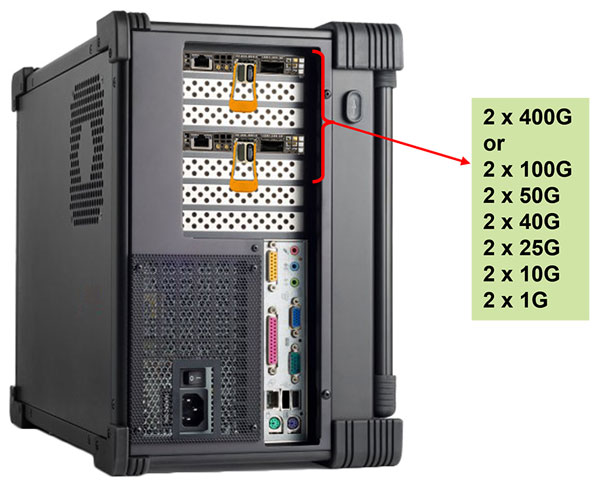
- Lossless Wirespeed Capture: Lossless wirespeed capture of IP traffic across high-speed (400, 200, 100, 50, 40, 25, 10, and 1 GigE) links
- Non-Intrusive Continuous Recording: Non-intrusive capture and continuous recording over Ethernet (electrical/optical) with nanosecond precision, retaining the latest traffic based on user-defined size
- Multi-Port Traffic Merging: Merges traffic from multiple ports with high-precision timestamps during recording
- Optimized Distributed Disk Operation: Optimized distributed disk operation to achieve wirespeed recording to disk
- Auto-Naming with Timestamps: Recording can be started without specifying a name; the system automatically assigns the current timestamp (YYYY-MM-DD_HH-Min-Sec) as the recording name
- Advanced Hardware Filtering: Apply efficient hardware filters based on MAC, 802.1Q (VLANs), IPv4/IPv6, Tunnel Traffic, TCP, UDP, and SCTP parameters to record only traffic of interest
- Real-Time Recording Metrics: Monitors total recording duration, L2 Rx rate, record rates, frame rates, captured frames, dropped frames, and recorded bytes for efficient and accurate high-speed packet capture
- Live Network Performance Monitoring: Provides real-time insights into port status, received frames, link utilization, capture rates, error counts, and frame-length distribution for efficient network performance analysis
- Graphical Rate and Error Analysis: Users can view Rate and Error Graphs for each port to analyze capture rates and detect issues like segment drops, Multi-Packet Receive Queue (MPRQ) buffer overflows, missed packets, and discarded packets during recording
PacketExtractor™ 400G
- Targeted Packet Extraction: Extract specific traffic from previous recordings into PCAP and PCAPNG (Wireshark® format) output traces
- Post-Extraction Analysis: Analyze the extracted trace in PacketScan™ HD or Wireshark®
- Flexible Output Trace Options: Extract packets into a single or multiple output traces
- Conditional Extraction Filters: Extract traces based on file size, time period, or packet count limit
- Time-Based Extraction: Perform extraction from user-specified start and end times
- Recording Status Indicator: Provides Recording Status options as Complete or Partial
- Packet Slicing for Efficiency: Slice packets to a limited length to optimize output trace size
- Extraction Metrics and Reporting: Provides detailed insights into the extraction process, including frame count, data volume, processing and extraction rates, and total duration for efficient traffic analysis
Use Cases for 400G
Data Centers
Supports cloud computing, big data analytics, AI model training, and east-west traffic within modern cloud-based infrastructures.
Telecommunications
Powers high-bandwidth applications like 5G networks, video conferencing, and streaming services.
Financial Services
Enables low-latency connections critical for high-frequency trading and real-time transaction processing.
Healthcare
Facilitates secure transfer of medical images, patient records, and supports telemedicine and IoT-enabled remote monitoring.
Media & Entertainment
Handles high-resolution video streaming (e.g., 4K/8K) and content distribution efficiently.
What is 400G?
400G refers to high-speed network connectivity or data transmission at a rate of 400 gigabits per second (Gbps). It represents a major leap in networking technology, offering enhanced bandwidth and capacity to meet the growing demands of modern applications. Often referred to as 400GbE (Gigabit Ethernet), it is based on the IEEE 802.3bs standard and enables faster data transfer across Ethernet or optical fiber networks.
Key features of 400G include:
- Advanced Modulation Techniques: Uses Pulse Amplitude Modulation with four levels (PAM4) to transmit more data per symbol compared to earlier standards like NRZ
- Higher Baud Rates and Multiple Lanes: Achieves 400 Gbps by combining multiple lanes (e.g., 4 lanes of 100 Gbps or 8 lanes of 50 Gbps)
- Error Correction: Employs Forward Error Correction (FEC) to ensure reliable data transmission by detecting and correcting errors
How Does 400G Work?
400G technology operates by leveraging advanced encoding schemes, higher signaling rates, and optical transmission techniques to achieve speeds four times faster than its predecessor, 100G Ethernet. It can transmit data over a single optical wavelength or multiple lanes, depending on the configuration.
Key components of its operation include:
- PAM4 Modulation: Enables higher data rates by encoding two bits per symbol, doubling the transmission capacity compared to NRZ modulation
- Single Optical Wavelength Transmission: Simplifies hardware setup, reduces power consumption, and lowers costs per bit
- Flexible Configurations: Supports either four 100GbE client services or one unified 400GbE client service, making it adaptable for diverse applications
Multi-Server Connectivity
The FastRecorder™ and PacketExtractor™ 400G web interface enables users to access multiple servers within the same LAN, allowing seamless connectivity and centralized management of multiple devices for improved efficiency and control.
Traffic Simulation Configuration
Emulate, capture, and analyze 400G network traffic in a controlled environment and test the performance of high-speed networking equipment (like switches, servers, and packet processors). Validate and benchmark how well hardware/software handles real-world traffic loads at 400 Gbps speeds.

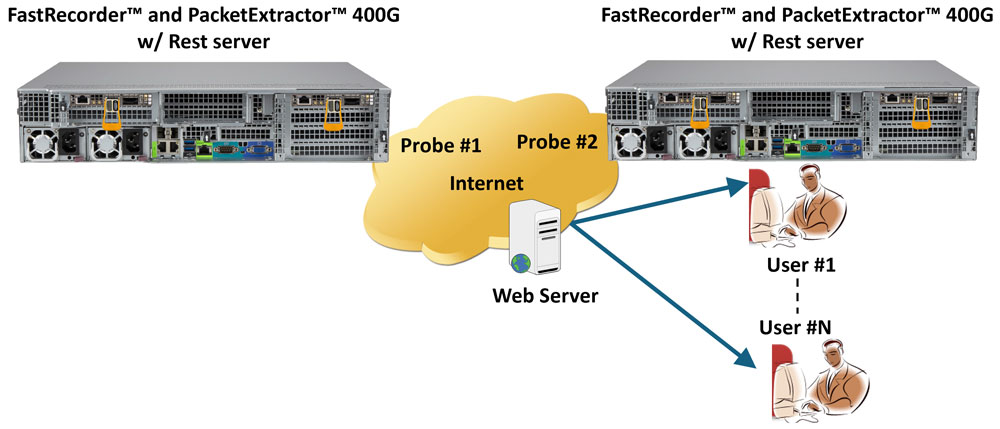
Field Configuration to Connect Real 400G East and West Traffic
Passively taps a live 400G network and captures east-west traffic separately for real-time monitoring and detailed packet analysis without disturbing the original communication.

Software Architecture
Shows the software architecture of a 400G fast packet recorder and extractor system. Captures, filters, processes, and efficiently stores 400G network traffic for real-time or offline analysis.

Performance Metrics
- Line Rate [400G] (MPPS) refers to the maximum number of millions of packets per second that a 400 Gbps network link can handle
Line Rate [400G] (MPPS) = ((400Gbps / 8) / (Frame Size + 20 Bytes))
Example for 64 bytes
Line Rate [400G] (MPPS) = (400000000000/8) / (64+20)) = 595,238,095 pps or 595.238 MPPS - Frame Rate (MPPS) - Millions of packets per second and represent the number of packets (or frames) a network interface card can process in one second, measured in millions, given by Nvidia
Frame Rate (MPPS) = (Line Rate [400G] (Mpps)) x (Line Rate %)
Example for 64 bytes
Frame Rate (MPPS) = (595.24) x (41.38 %) = 246.31 MPPS - % Line Rate represents the link utilization of a network device based on the frame rate (MPPS) it can handle. It measures how efficiently the device processes packets relative to its maximum capacity
| Frame Size (Bytes) |
Frame Rate (MPPS) |
Line Rate [400G] (MPPS) |
% Line Rate |
|---|---|---|---|
| 64 | 246.28 | 595.24 | 41.38 |
| 72 | 224.89 | 543.47 | 41.38 |
| 128 | 168.29 | 337.84 | 49.81 |
| 256 | 126.22 | 181.16 | 69.68 |
| 512 | 93.98 | 93.98 | 100 |
| 1024 | 47.89 | 47.89 | 100 |
| 1280 | 38.46 | 38.46 | 100 |
| 1518 | 32.51 | 32.51 | 100 |
| Emix (Frame Size : 66, 128, 256, 512, 1024 bytes) |
113.13 | 119.84 | 94.25 |
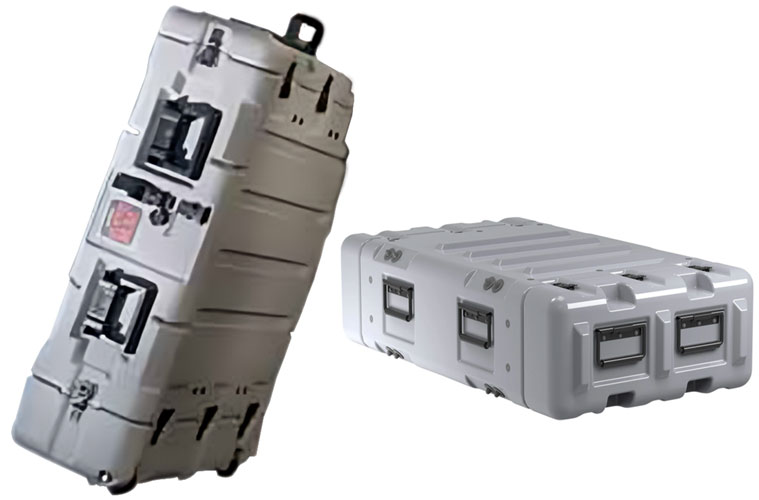
Rugged Transportable Case
- Custom, robust, shock resistant
- Inside rails, easy to slide out, connect to power, connect to system, checkout and start recording
- Inherent remote operation
Frequently Asked Questions
- What is the main purpose of FastRecorder™ and PacketExtractor™?
- They are designed for high-speed data capture and extraction for network diagnostics, ensuring wirespeed recording without packet loss.
- What is the maximum supported Ethernet rate?
- Up to 400 Gbps.
- What storage capacity do FastRecorder™ and PacketExtractor™ support?
- FastRecorder™ supports up to 240 TB using NVMe SSDs, while PacketExtractor™ can handle raw recordings up to 256 TB.
- What types of connections does FastRecorder™ support?
- It supports both copper and fiber (SM or MM) connections.
- How does FastRecorder™ ensure efficient and accurate high-speed packet capture?
- By monitoring total recording duration, L2 Rx rate, record rates, frame rates, captured frames, dropped frames, and recorded bytes.
- What kind of statistics does FastRecorder™ provide?
- It provides general statistics such as record duration, capture rate, record rate, frame rates, dropped frames, recorded bytes, and port statistics including link status, received frames, link utilization, capture rate, error counts, and frame-length counters.
- What type of graphs are available in FastRecorder™?
- Rate Graph and Error Graph.
- What errors does the Error Graph highlight?
- Segment Drop Error, Out of MPRQ Buffer Count, iMissed Packet Count, Discarded Packet Count.
- What can users do with the extracted trace from PacketExtractor™?
- Analyze the extracted trace in PacketScan™ HD or Wireshark®.
- What output formats does PacketExtractor™ support?
- PCAP and PCAPNG.
- What kind of statistics does PacketExtractor™ provide?
- It provides statistics such as processed and extracted frame counts, data volume, processing and extraction rates, and total extraction duration.
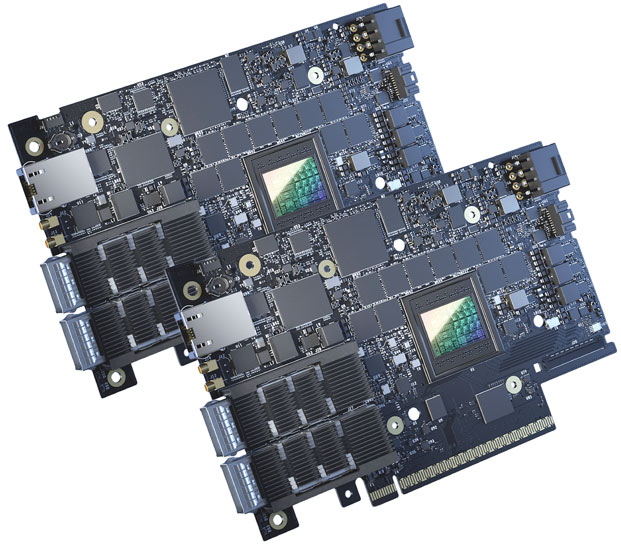
- What Data Processing Unit (DPU) is used?
- Nvidia BlueField-3 BF3240 P-series NDR/400GbE dual port QSFP112.
- What does the multi-server connectivity feature enable?
- It enables users to access multiple servers within the same LAN for centralized management of multiple devices.
- What are other related software and hardware mentioned?
- PacketScan™ HD (with various GigE configurations) and PacketScan™ (Real-time and Offline).
FastRecorder™ and PacketExtractor™ 400G Rackmount Platforms
- Ideal for Lab environments that require centralized management of multiple servers and network devices
- Rackmount units offer flexibility for scaling up or down as needed by adding or removing individual units

400G 2U Rackmount Front panel
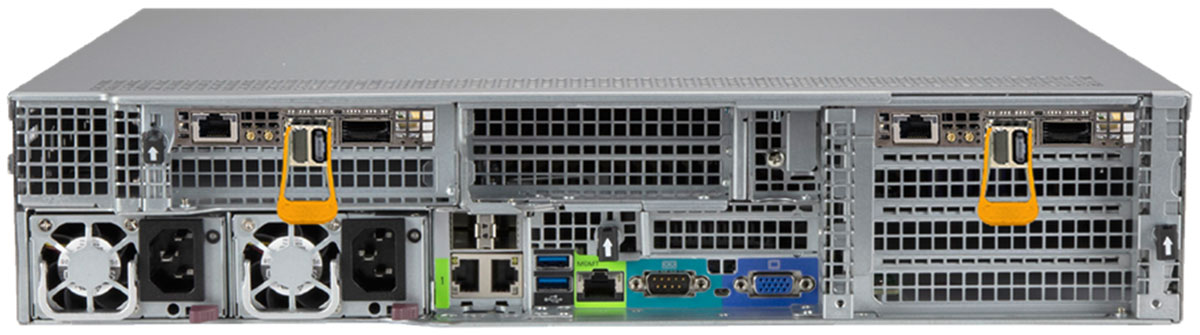
400G 2U Rackmount Back panel

400G 2U Rackmount Top view
FastRecorder™ and PacketExtractor™ 400G Portable Platforms
- Ideal for field engineers, military personnel, or researchers who need a powerful and portable computing solution in remote or rugged locations
- Suitable for environments where traditional desktops or laptops may be too fragile or lack necessary durability
| High-Performance Server Configuration | |
|---|---|
| CPU | AMD EPYC 9655 96-Core Processor@ 2.60GHz 96 CPU cores * 2 NUMA nodes |
| RAM | 768GB: 24 * 32GB DIMMs (2 NUMA nodes) @ 6400MHz |
| Data Processing Unit (DPU) | Nvidia BlueField-3 BF3240 P-series NDR/400GbE dual port QSFP112, PCIe Gen5.0 x16 FHHL; Crypto Enabled; 32GB on board DDR; integrated BMC; Tall Bracket |
| Host Operating System | Red Hat Enterprise Linux 9.5 (Plow) |
| Host Kernel Version | 5.14.0-503.21.1.el9_5.x86_64 |
| Host GCC version | 11.5.0 20240719 (Red Hat 11.5.0-2) |
| DPU BFB Image | bf-bundle-2.7.0-33_24.04_ubuntu-22.04 |
| Mellanox NIC firmware version | 32.43.2026 |
| Mellanox OFED driver version | MLNX_OFED 24.10-1.1.4 |
| DPDK version | 24.07 |
| High-Speed Packet Capture and Recording Card (DPU) | |
|---|---|
|
 |
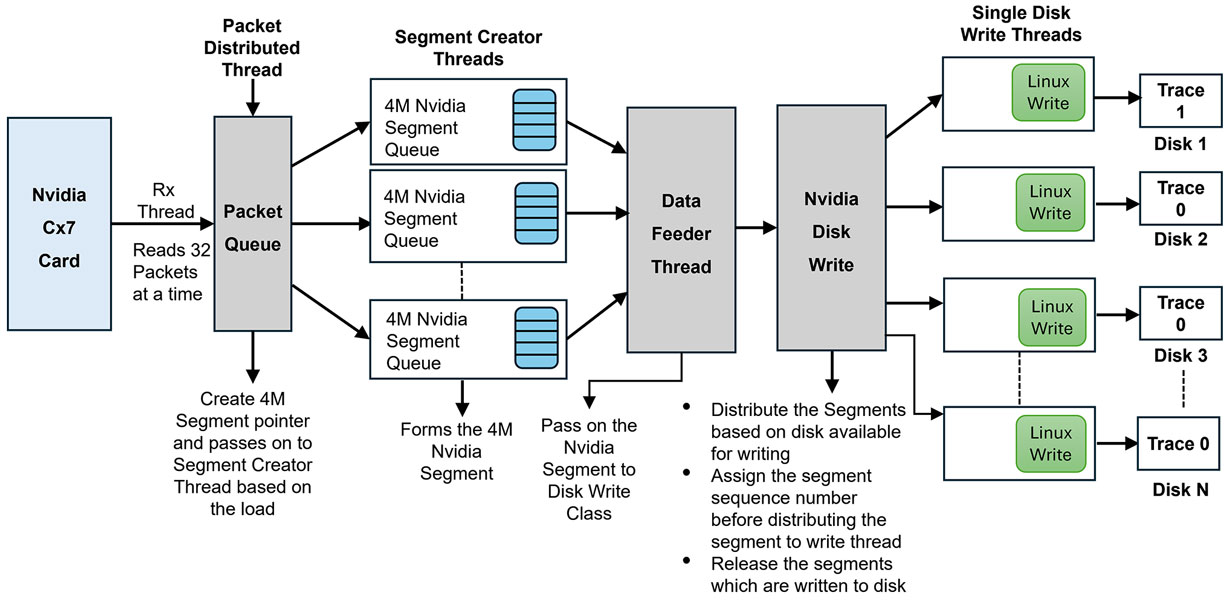
FastRecorder™ Architecture
The system employs Receive Side Scaling (RSS) to distribute incoming network traffic across multiple queues based on a 7-tuple hash - MAC/IP/UDP, ensuring that packets from the same flow are consistently directed to the same queue. This mechanism allows FastRecorder to deploy multiple polling threads to efficiently process these queues (16) in parallel.
Additionally, Multi-Packet Receive Queues (MPRQ) is utilized to stack multiple packets into a single buffer, reducing the overhead associated with packet processing. Each MPRQ buffer is 32KB in size, and FastRecorder aggregates these individual 32K buffers into larger 4MB segment buffers for optimized disk writing.
A data feeder thread is responsible for sending the segmented data to the Nvidia disk writing system, which balances the load across multiple disks. Each disk is managed by Linux write threads, and individual traces are written to different disks. This architecture supports continuous, high-speed packet capture to NVMe SSDs and enables scalable, error-free data logging for applications requiring high data throughput.
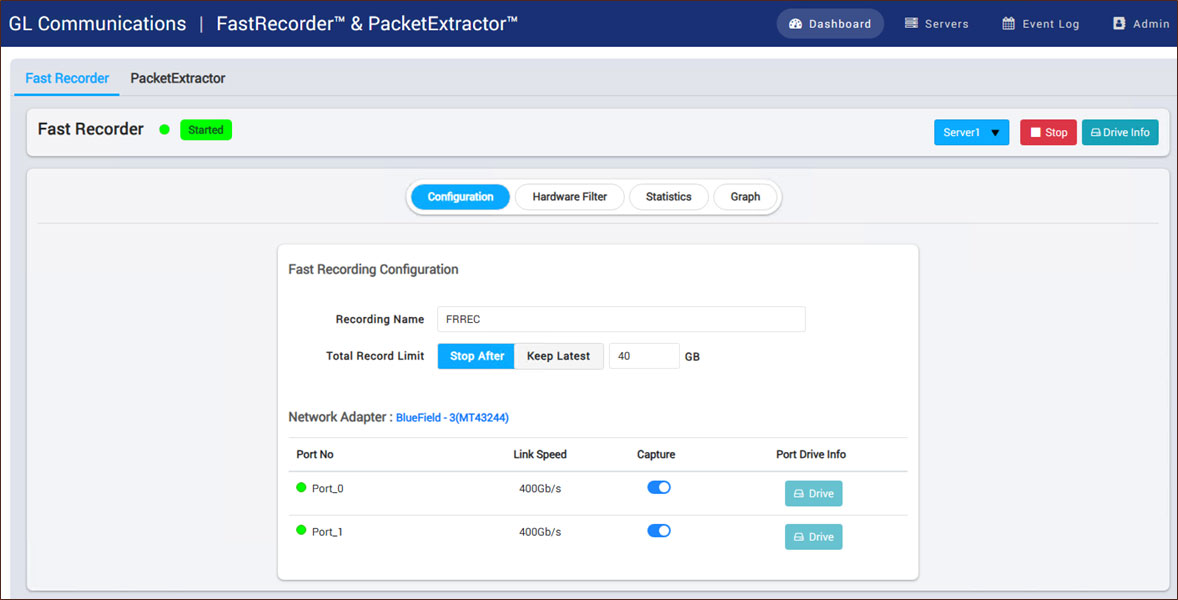
FastRecorder™ application provides various options to capture the high density real-time traffic on disk drives and store the recorded traffic into a file. The application can capture the traffic continuously until the user stops the recorder or specify the size limit to stop the traffic capture.
Hardware Filters
Hardware-based filters leverage DPDK’s flow steering on the BlueField-3 card, supporting L2/L3/L4 headers, VLANs, and tunnel encapsulation. Filtering can be based on parameters such as Ether Type, VLAN ID, IP addresses (IPv4/IPv6), protocol, TOS/DSCP, UDP/TCP ports, VxLAN Network Identifier, and GTP TEID with inner IP addresses and ports. Offloading filtering to hardware reduces software overhead, improves throughput, and enhances system efficiency.
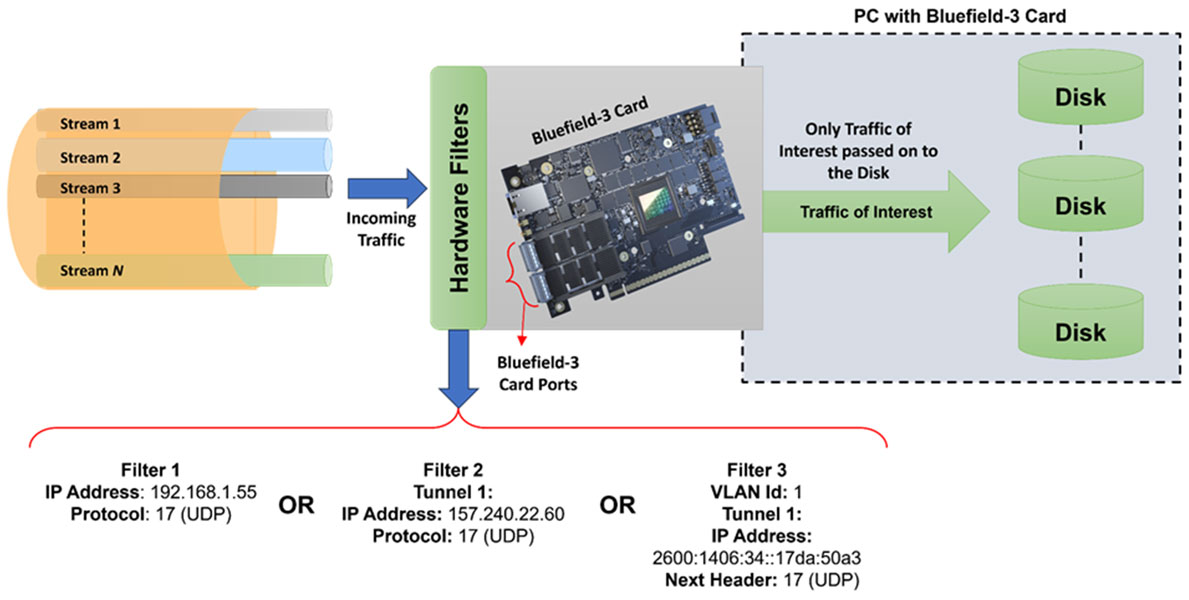
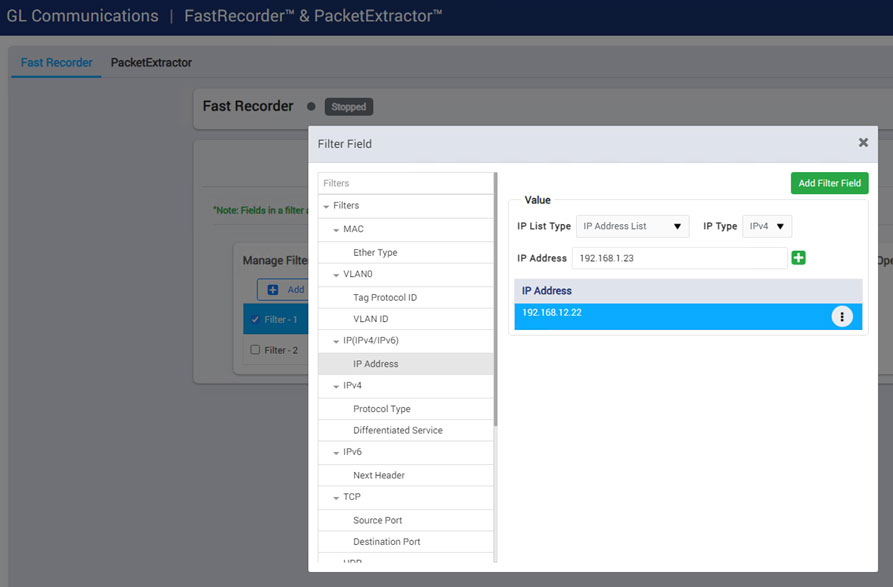
The Hardware Filter option allows users to easily set up filter conditions to capture only the traffic of interest at line rate, while filtering out unwanted traffic. Filters can be modified on the fly. In this example, the specified IPv4 address is filtered.
FastRecorder™ Statistics
General Statistics
Provides key recording metrics such as duration, capture and record rates, frame statistics, dropped data, and total recorded bytes to monitor high-speed traffic capture performance.
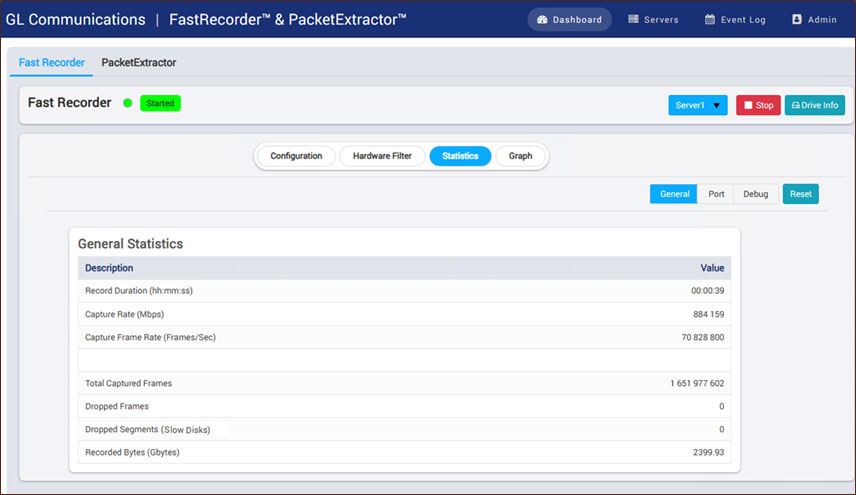
- Record Duration (hh:mm:ss): Displays the total recording duration in hours, minutes, and seconds
- L2 Rx Rate (Gbps): Displays the total capture rate of all selected ports on the capture interface in gigabits per second
- Record Rate (Gbps): Shows the total record rate of all selected ports on the capture interface in gigabits per second
- Capture Frame Rate (Frames/Sec): Displays the total number of frames received per second on the capture interface
- Total Captured Frames: Represents the total number of frames recorded during the capture session
- Dropped Frames: Shows the number of frames that were not captured due to buffer limitations or other constraints
- Dropped Segments (Slow Disks): Indicates the number of segments lost due to insufficient disk write speed
- Recorded Bytes (Gbytes): Shows the total number of bytes recorded in the current session, measured in gigabytes
Port Statistics
Displays comprehensive port-level statistics including link status, frame and bandwidth metrics, error counters, and frame length distribution for detailed traffic analysis.
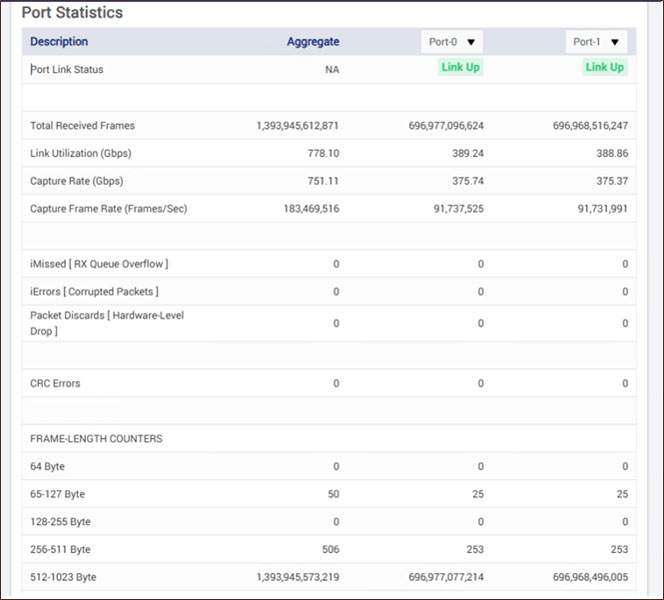
- Port Link Status: Displays if the port link is up or down
- Total Received Frames: Indicates the total number of frames successfully received on the capture interface during the recording session
- L1 Rx Rate (Gbps): Indicates the total bandwidth usage on the capture interface in gigabits per second
- L2 Rx Rate (Gbps): Displays the total capture rate of all selected ports on the capture interface in gigabits per second
- Capture Frame Rate (Frames/Sec): Shows the total number of frames received per second on the capture interface
- iMissed [RX Queue Overflow]: Indicates the number of missed packets due to receive queue overflow
- iErrors [Corrupted Packets]: Displays the number of packets received with errors due to corruption
- Packet Discards [Hardware-Level Drop]: Indicates the number of packets dropped at the NIC's hardware ring buffer due to lack of buffers for DMA operation towards application
- CRC Errors: Shows the count of packets with cyclic redundancy check (CRC) failures due to transmission errors
- FRAME-LENGTH COUNTERS: The following counters indicate the number of frames captured within specific byte length ranges for traffic analysis
- 64 Byte: Shows the number of received frames with a length of 64
- 65-127 Byte: Displays the count of received frames with lengths between 65 and 127 bytes
- 128-255 Byte: Displays the count of received frames with lengths between 128 and 255 bytes
- 256-511 Byte: Indicates the count of received frames with lengths between 256 and 511 bytes
- 512-1023 Byte: Shows the count of received frames with lengths between 512 and 1023 bytes
- 1024-1518 Byte: Displays the count of received frames with lengths between 1024 and 1518 bytes
- 1519-2047: Shows the count of received frames with lengths between 1519 and 2047 bytes
- 2048-8191: Displays the count of received frames with lengths between 2048 and 8191 bytes
- 4096-8191: Indicates the count of received frames with lengths between 4096 and 8191 bytes
- 8191-Max Byte: Displays the count of received frames with lengths from 8192 bytes up to the maximum supported frame size
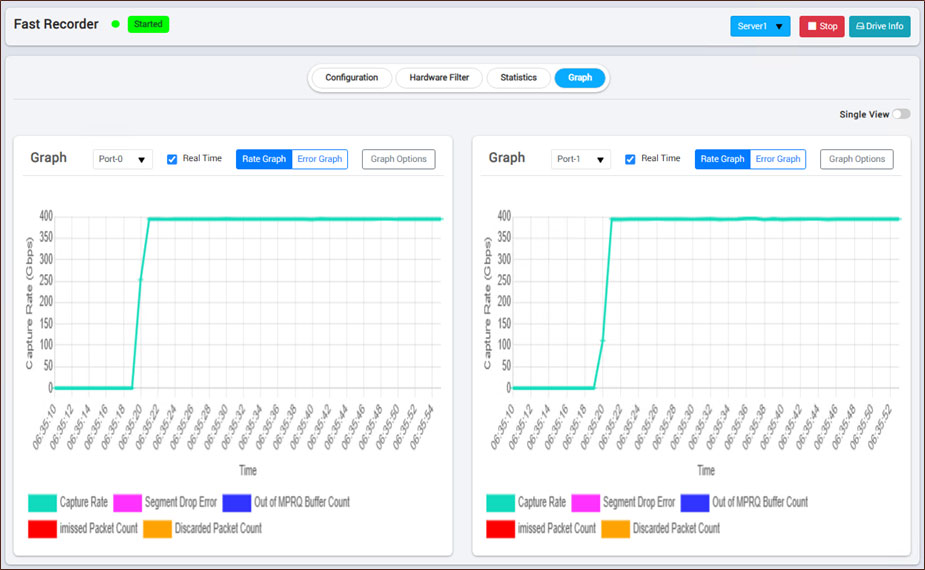
Graphs
Users can view two types of graphs for each port: Rate Graph and Error Graph.
Rate Graph
The Rate Graph shows the capture rate of a recorded or ongoing recording file and indicates errors detected at a specific instance during capture or recording.
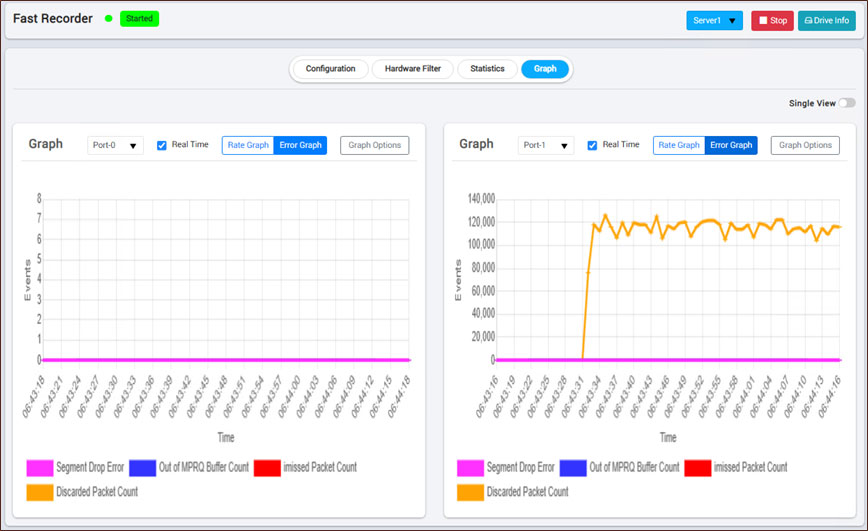
Error Graph
The Error Graph highlights errors that occurred at specific instances. The Error Graph displays errors that occurred on each port during recording or in a recorded file. It provides insights into issues such as:
- Segment Drop Error – Indicates packet drops due to slow disk performance
- Out of MPRQ Buffer Count – Shows the number of packets lost due to insufficient MPRQ buffers, this occurs that disk write has consumed all the available 4MB ( made up of multiple MPRQ buffers) and NIC doesn't have any of these left to DMA the incoming frames
- iMissed Packet Count – Represents the number of packets dropped because the MPRQ queue overflow, this indicates the sluggishness at application in picking the MPRQ buffers from NIC
- Discarded Packet Count – Captures packets that were dropped at the NIC's hardware ring buffer due to lack of MPRQ buffers for DMA operation towards application
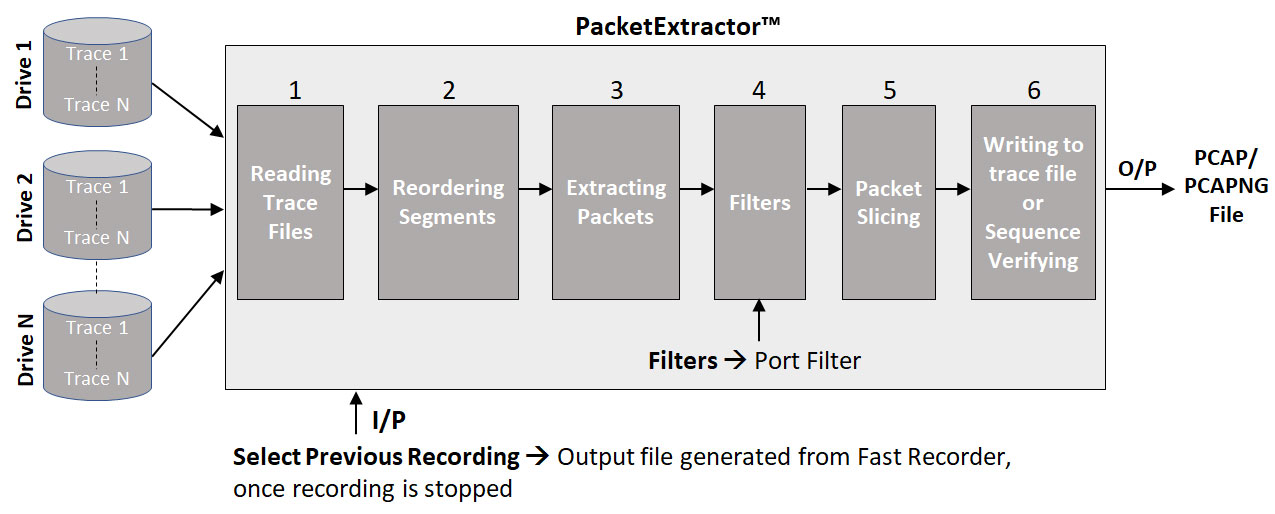
PacketExtractor™ Architecture
The architecture of PacketExtractor™ outlines a process that retrieves packets from previously recorded traces across multiple drives. It starts with reading the trace files, followed by segment reordering to ensure proper sequence. Filters, such as port-specific ones, are applied to extract relevant packets. Optionally, packets may be sliced to focus on specific sections, such as headers. Once processed, the packets are either written back to a trace file or verified for sequence accuracy, with the final data saved in PCAP or PCAPNG format for detailed analysis.
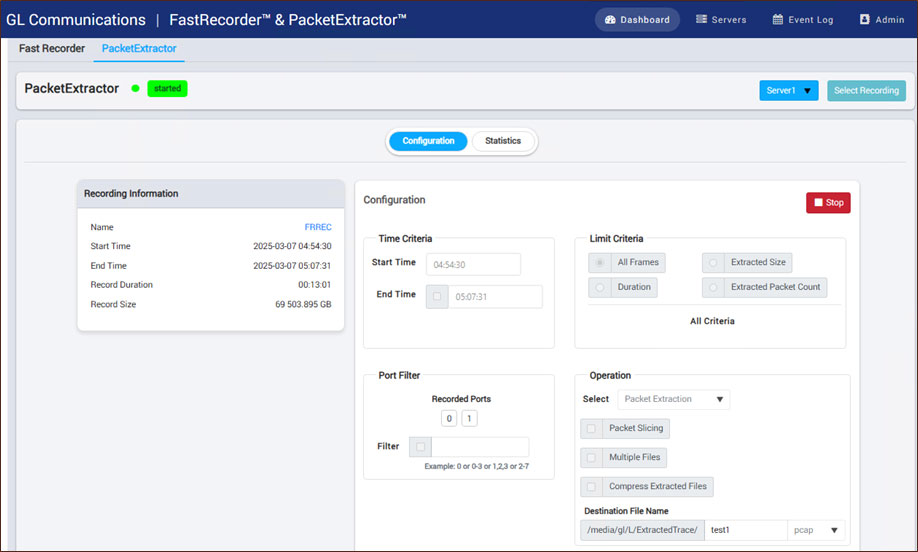
PacketExtractor™ enables efficient extraction of recorded network traffic with flexible filtering and export options. Users can define time limits, apply filters, and select specific ports for targeted extraction. The application supports packet slicing, multiple file exports, and compression, with output saved in PCAP format for analysis.
Extraction Statistics
Provides key extraction metrics including processed and extracted frame counts, data volume, processing and extraction rates, and total extraction duration.
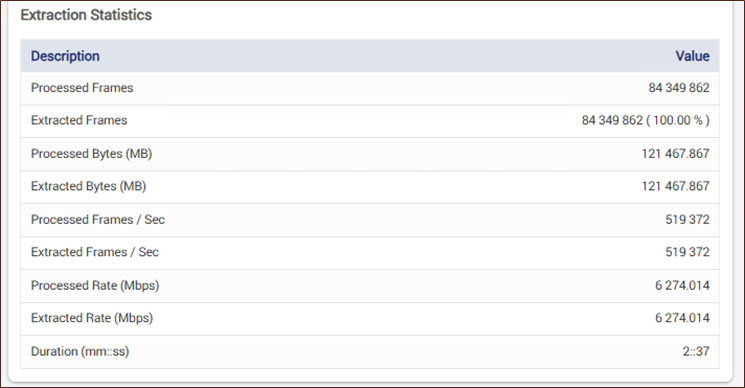
- Processed Frames: The total number of frames analyzed during the extraction process
- Extracted Frames: The number of frames successfully extracted from the processed frames
- Processed Bytes (MB): The total amount of data processed, measured in megabytes
- Extracted Bytes (MB): The total amount of extracted data, measured in megabytes
- Processed Frames/Sec: The rate at which frames are processed per second
- Extracted Frames/Sec: The rate at which frames are extracted per second
- Processed Rate (Mbps): The speed at which data is processed, measured in megabits per second
- Extracted Rate (Mbps): The speed at which data is extracted, measured in megabits per second
- Duration (mm:ss): The total time taken for extraction, displayed in minutes and seconds
Resources
| Item | Product Description |
|---|---|
| PKV123 | FastRecorder™ and PacketExtractor™ for Monitoring IP Networks |
| Related Software and Hardware | |
| PKV122 | PacketScan™ HD – High Density IP Traffic Analyzer w/ 2x10GigE |
| PKV124 | PacketScan™ HD – High Density IP Traffic Analyzer w/ 2x40/100GigE |
| PKV100 | PacketScan™ (Real-time and Offline) |
| PKV101 | PacketScan™ - Offline |